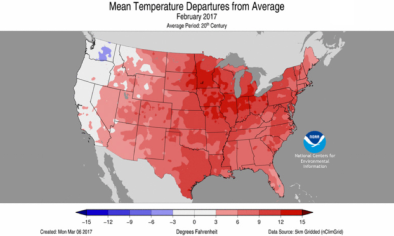
US Current Year Average Temp as Departure from Normal
Global Historical Climatology Network–Daily (GHCN-D)
Using the Tools
Temperatures on the maps are shown as departures (in degrees Fahrenheit) from the 1981–2010 average. For the year-to-date maps, departures are based on the normal average observed as of that date.
You can hover over an individual station to view the station ID and the current departure from normal value for that station.
Click on any station to view a detailed plot for the year to date or previous full year.
The temperature plots show observed daily maximum and minimum temperatures, the 1981–2010 average maximum and minimum temperature range, and the record maximum and minimum range. New records observed in the current year high indicated with colored dates.
For more tools, click here.
Related Content
Headline
Mar 15, 2017 | NOAA Climate.gov
What Does 2017 Look Like in Your Neck of the Woods?
Science Source
| World Weather Attribution
U.S. Heat, February 2017
Geert Jan van Oldenborgh, Andrew King, Friederike Otto et al
Headline
Mar 9, 2017 | New York Times
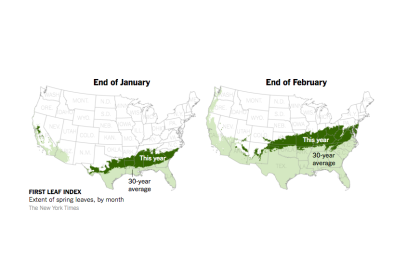
Spring Came Early. Scientists Say Climate Change Is a Culprit.
Headline

Mar 8, 2017 | Category 6
Second Warmest U.S. February on Record: Chalk It Up to Greenhouse Gases
