Antarctic Melt 1992 -
Recently observed changes in Antarctica are widely attributed to rapid increases in regional surface air temperature as well as changing ocean currents due global warming. Climate change in the Antarctic region contributes to sea level rise, plays a critical role in global weather formation, and is a pivotal force in determining ocean currents.
In recent decades, hundreds of glaciers draining the Antarctic Peninsula have undergone systematic and progressive change. Studies raise the possibility that the Greenland and Antarctic ice sheets might be far less stable than previously assumed. Recent observation of free flowing surface melt and basal melt are some of the latest indications that conditions may now be in place for rapid melt in Antarctica. The major uncertainty regarding catastrophic sea level rise due to Antarctic ice loss is when (not if) sea levels will increase dramatically.


Climate science at a glance
- Antarctica has experienced rapid increases in regional surface air temperature as well as changing ocean currents linked to global warming.
- Antarctica broke its hottest temperature on record in February 2020, beating the previous record set in March 2015.
- While some localized areas may be cooling and/or gaining ice, these examples are not nearly enough to reverse the warming trend.
- Accelerating ice loss from the Antarctic ice sheet is a major contributor to global mean sea level rise.
- The Antarctic ice sheet stores the equivalent of approximately 190 feet of level rise.
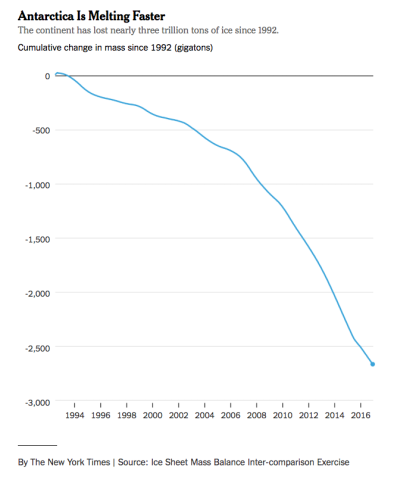
- Mass loss from the Antarctic ice sheet over the period 2007–2016 tripled relative to 1997–2006.
- Melting from below is causing most of the continent's ice shelves (ice that extends out over the ocean) to grow thinner.
- Antarctic sea ice extent overall has had no statistically significant trend.
Climate signals breakdown
Climate signal #1: Global Warming
Antarctica has witnessed a continent-wide positive warming trend over the last 50 years.[1] The Antarctica Peninsula has experienced the strongest warming, followed by West Antarctica, while East Antarctica and the continental interior have at times shown cooling trends.[1]
Observations consistent with climate signal #1
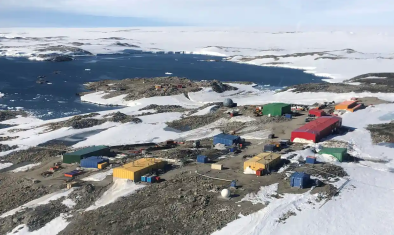
- Antarctica logged its hottest temperature on record in February 2020, with an Argentinian research station thermometer reading 64.9°F (18.3°C), beating the record of 63.5°F (17.5°C), set in March 2015 by 1.4°F (0.8°C).[2]
- Satellite and weather station data report that Antarctica has warmed at a rate of about 0.22°F (0.12°C) per decade since 1957, for a total average temperature rise of 1°F (0.5°C).
- There has been a southward shift in the distribution of the Antarctic krill population in the South Atlantic are associated with climate-linked environmental changes.
Climate signals #2 and #3: Glacier and Ice Sheet Melt and Sea Level Rise
In recent decades, hundreds of glaciers draining the Antarctic Peninsula have undergone systematic and progressive change. These changes are widely attributed to rapid increases in regional surface air temperature as well as changing ocean currents.[3] Sea level rise has accelerated in recent decades due to the combination of increased ice loss from the Greenland and Antarctic ice sheets.
Antarctica holds about 90 percent of the world's ice, which raises major concerns about the impacts on sea level rise of warming temperatures and melting in Antarctica. The retreat and ultimately final collapse of the entire West Antarctic ice sheet, contributing 23 feet of sea level rise, has probably become ‘unstoppable’.[4][5][6] The Antarctic ice sheet stores the equivalent of approximately 190 feet (58 meters) of global mean sea level rise.[7] Its potential sea-level contribution within the next 10,000 years far exceeds that of all other possible sources.[7]
Some localized areas may be cooling and/or gaining ice. These examples, however, are not nearly enough to reverse the overall warming and melting trend. Research has shown that any gains in the East Antarctic Ice Sheet are being offset by the more significant losses from the West Antarctic Ice Sheet and the Antarctic Peninsula Ice Sheet. Over the same period (1992 to 2011) that the East Antarctic Ice Sheet gained mass, the whole of Antarctica lost an estimated 1,350 gigatons of ice.[8]
Ice shelves are collapsing
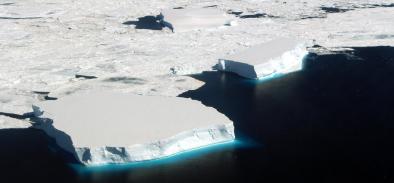
 Some of the biggest changes in Antarctica are occurring where warm ocean water is able to access thick, floating ice shelves from below in the Amundsen and Bellingshausen Seas, a process known as basal melting.[9]
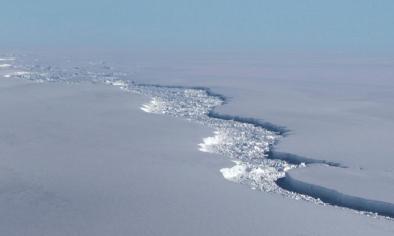
Antarctica's ice shelves—pictured to the right—form through the extension of glaciers into the ocean and float in water where they provide structural support to the glaciers that rest on land. Warming temperatures are causing Antarctica's ice shelves to retreat.
When ice shelves collapse, they contribute very little to global sea level rise because they already rest on and displace water. Of greater concern is how the collapse of ice shelves can affect the glaciers behind them, because the melting of those glaciers can cause much higher levels of ocean rise.
In the Antarctic Peninsula's Weddell Sea, two ice shelves have already disintegrated—Larsen A in 1995 and Larsen B in 2002. A September 2014 study finds that the collapse of Larsen B was the result of warmer air temperatures.[10] Larsen C—Antarctica's fourth-largest ice shelf—has retreated significantly since the 1980s and experienced significant calving in July 2017, creating one of the largest icebergs ever recorded. The ice shelf is now at its smallest size on record.[11][12] A December 2014 study finds shelf basal melt in the Bellinghausen and adjacent Amudsen Seas is being driven by ocean water that has become steadily warmer and saltier over a timeframe of four decades.[13] The ice shelves in the Amundsen Sea are especially important, because they are connected to two large glaciers—the Pine Island and Twaites Glaciers—that have dramatically increased in flow velocity.
Observations consistent with climate signals #2 and #3
- During the period from 2006 to 2015, the Antarctic Ice Sheet lost mass at an average rate of 155 gigatons per year (0.43 millimeters per year), mostly due to rapid thinning and retreat of major outlet glaciers draining the West Antarctic Ice Sheet.[14]
- Mass loss from the Antarctic ice sheet over the period 2007–2016 tripled relative to 1997–2006.[14]
- Acceleration of ice flow and retreat in Antarctica is observed in the Amundsen Sea Embayment of West Antarctica and in Wilkes Land, East Antarctica.[14]
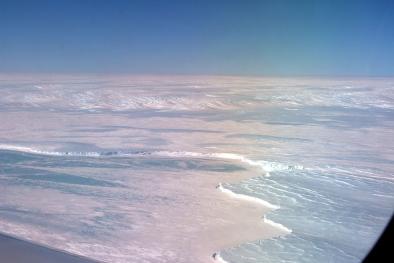
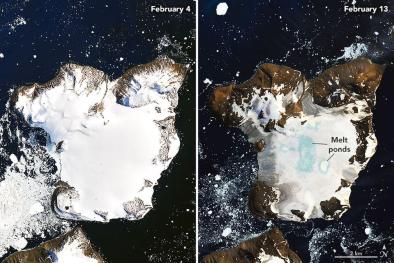
- A continent-wide survey published in April 2017 found extensive drainages of meltwater flowing over parts of Antarctica's ice during the summer season.[15] These features were thought to be confined mainly to Antarctica’s fastest-warming, mostly northerly regions. Future warming could significantly magnify their influence on sea level.[15][16]
- In West Antarctica, a May 2014 study finds that the Pine Island and the Twaites Glacier, together with four other large West-Antarctic glaciers has picked up speed.[4] The Twaites Glacier partially holds all the other glaciers in place and is essential to the entire West Antarctic Ice Sheet. On the opposing side of the Antarctic Peninsula, in the Bellinghausen Sea, there has also been a partial collapse of a large ice shelf in recent years: the Wilkins shelf in 2008.[17]
- The sum of ice sheet and glacier contributions over the period 2006–2015 is the dominant source of sea level rise, exceeding the effect of thermal expansion of ocean water (0.10 inches or 1.4 mm per year). Sea level rise is occurring at a rate of about 0.07 inches (1.8 mm) per year.[14]
Climate signal #4: Sea Ice Change
The story of sea ice in Antarctic is complicated. In spite of warming temperatures, sea ice extent in some areas of Antarctica has increased.[18] Research suggests this is due to reduced mixing between warm and cool layers in the ocean that ordinarily speeds the melting of ice.[18] The previously mentioned wind patterns induced by ozone depletion may also play a role.[19] However, neither sea ice loss nor sea ice formation make a significant change in sea levels, exactly as melting ice in a glass of water does not significantly raise the level of water in the glass.
Observations consistent with climate signal #4
- Antarctic sea ice extent overall has had no statistically significant trend (1979–2018) due to contrasting regional signals and large interannual variability.[14]
- Sea ice associated marine mammals and seabirds have experienced habitat contraction linked to sea ice changes.[14]
Ice sheet dynamics are not linear: large scale ice sheet collapse and rapid sea level rise
Large-scale melting of both the Antarctic and Greenland Ice Sheets include large-scale losses of ice, potentially leading to tens of feet of sea level rise. Although most of these losses are projected as being unlikely to occur before 2100, we may pass the point where these losses will be set in motion in the coming decades, with at least a slight chance that we have already done so. A sea level rise speed of multiple meters (many feet) per century is possible if positive melting feedbacks are activated. Many positive feedbacks have already been suggested and are all subject of ongoing investigation, through modeling, paleo research and in situ (on site) observations.[20]
In Antarctica, the instability of ice shelves, glaciers, and ice sheets threatens abrupt and large losses from both the West Antarctic Ice Sheet (WAIS) and portions of the East Antarctic Ice Sheet.[6] Any significant ice loss likely would be irreversible for thousands of years.[6] Simulations of warming and ice loss during earlier warm periods of the past 5 million years indicate these areas can contribute 23 feet of sea level rise.[5][6]
A March 2016 study by Hansen et al shows why the Greenland and Antarctic ice sheets might be far less stable than previously assumed, raising the possibility of 2 to 5 meters (6.6 to 16.4 feet) sea level rise, within this century.[21] A second study published in March 2016 by DeConto and Pollard identifies a mechanism for accelerated melting of the Antarctic ice sheet, which could raise global sea levels to 2 meters by 2100.[22]
Over the long-term, paleoclimate records indicate that greenhouse gas emissions in the 20th and 21st centuries could cause 95 to 180 feet (29 to 55 meters) of sea level rise, depending on future emissions levels.[23] Many current projections of global sea level rise do not account for the complicated behavior of Antarctica's giant ice slabs as they interact with the atmosphere, the ocean and the land. Lack of knowledge about the ice sheets and their behavior is the primary reason that projections of global sea level rise include such a wide range of plausible future conditions.
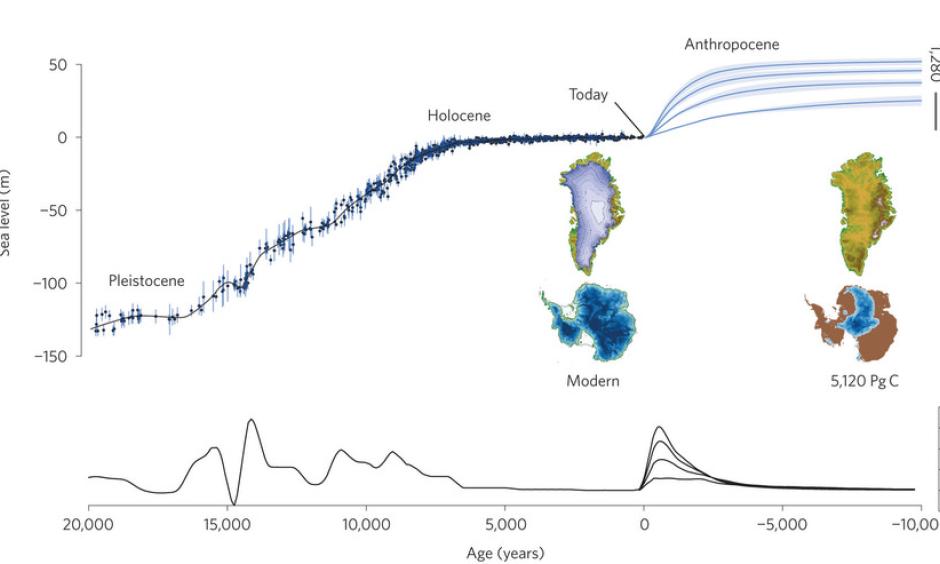
The above image shows that sea level changes in response to climatic changes are intrinsically slow – following the large thermal mass of oceans and ice sheets. But if you look at the millennium-scale you see that sea level changes to several degrees of warming are also very large – and what happened between the cold and mild state of Earth (Pleistocene-Holocene boundary) could repeat itself between the mild and hot state of Earth (Holocene-Anthropocene boundary – following human carbon emissions). The big uncertainty is the speed of change.[23][24]
Antarctic ice loss mechanisms
The characteristic of melting in Antarctica is very different than that of Greenland (which mostly experiences surface melting). In Antarctica, ice shelves along the coast—which support adjacent glaciers on land—play a key role, and their disappearance leads to possible strong acceleration of ice sheet mass loss.[20]
- Warm air melts ice sheets and ice shelves from above, thinning them, and meltwater runs off.
- Formation of melt water ponds. Compared to ice, meltwater ponds are dark, and thus absorb more light, converting it into heat energy, which leads to melting and run-off.
- Meltwater lubrication: Surface meltwater stored in ponds and crevasses can weaken and fracture ice shelves, triggering their rapid disintegration. Meltwater may be acting as a lubricant, increasing the glacier/ice sheet flow, and by doing so the transportation of ice towards the ocean. This is not fully established, even for Greenland, as a current mechanism, and is very theoretical for Antarctica. While two April 2017 studies find that the direct effects of surface meltwater, which generally refreezes in winter, are probably negligible for now, glaciologists are concerned this could change in the future.[15][16]
- Hydrofracturing: Meltwater, warm temperatures and rainfall can fracture ice shelves making them vulnerable to collapse.
- Basal melting: Warm ocean currents melt away, from underneath, both ice shelves and sheets plunging down off the continent and over the surrounding sea.
- Changing ocean circulation brings warmer currents up under floating ice sheets/shelves, driving basal melting. These changing ocean currents may be driven by changing winds that in turn are driven by global warming.
- Collapse of floating ice shelves (due to basal melting, thinning due to warming air temperatures, and hydrofracturing) releases the formally buttressed ice sheets, triggering faster flow into the ocean.
- Marine Ice Cliff Instability (MICI) facilitates ice sheet disintegration. MICI is a weakening or structural failure of shear ice cliffs as warming temperatures increase crevasses and reduce the maximum supported cliff heights.
- Warming sea and air temperatures can melt sea ice that otherwise blocks the flow of ice sheets.
Related Content