Central and Eastern US Heat Wave June - July 2018
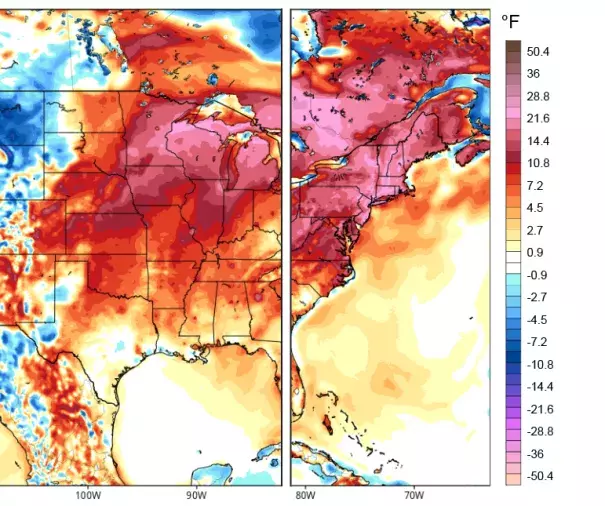
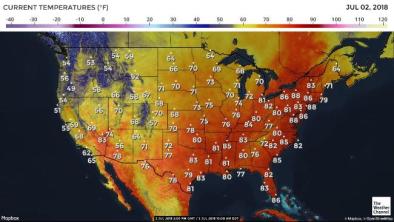
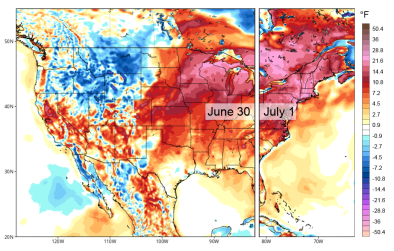
The first widespread heat wave of summer 2018 triggered excessive heat advisories and warnings in late-June and early-July across much of the central and eastern United States. A combination of high temperatures and high humidity will likely result in dangerous conditions. Daily record highs spread from the Plains into the Great Lakes and Northeast through the weekend of June 30 - July 1. Anomalously warm temperatures continued during the first week of July.
The increasing frequency and intensity of heat waves is among the most obvious and well-documented effects of climate change.[1]


Climate science at a glance
- The fingerprint (or influence) of global warming has been firmly identified in the increasing intensity, duration and frequency of extreme heat events globally.[1][2][3][4][5][6][7][8][9][10]
- Four out of five record-hot days globally are now attributed to climate change.[1]
- A small shift in climate leads to a dramatic increase in the frequency of extreme temperatures.[11][12]
- There has been a dramatic increase in hot night-time temperatures in the US, reducing the number of critically important relief windows during heat waves.[13]
- A warmer atmosphere can hold more moisture, and high humidity drives up the heat stress index dramatically.[14]
- In the United States, exposure to extreme heat is already a significant public health problem and a leading cause of weather-related mortality.[15]
Background
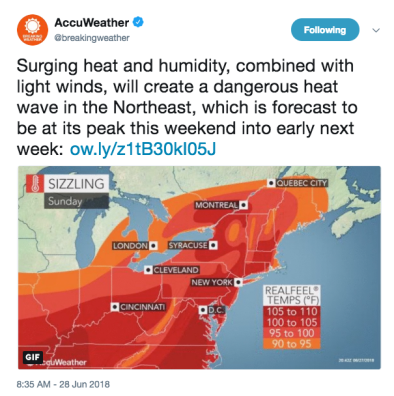
In the northeast, an official heat wave occurs when temperatures soar to 90°F or higher for at least three days in a row. Multiple days of high heat can become dangerous because the body doesn't have a chance to cool down.
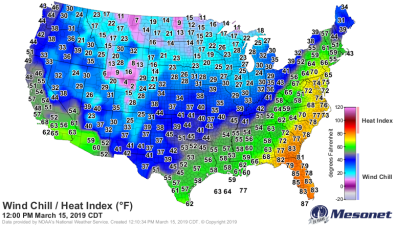
High temperatures are often discussed in terms of the Heat Index, which factors in the air temperature and relative humidity to determine the full impact of the event. The Heat Index is a more useful indicator of health risks than air temperature alone because humidity impedes the innate evaporative cooling mechanism of human bodies which cool down by producing moisture that evaporates taking heat with it. With more moisture in the air, the moisture human bodies produce cannot readily evaporate.
Climate signal breakdown
Climate signal #1: extreme heat
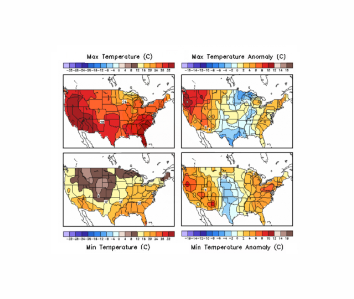
In the Midwest and northeastern United States, late-June and early-July temperatures and humidity levels soared to ranges more typical of summer's peak, with heat index values in the 100s. The extreme heat values bore several signatures of heat waves on a warming planet: record-breaking heat, hot nights, and increasing frequency.
Observations consistent with climate signal #1
-
Denver tied its all-time record high of 105°F on June 28.[16]
-
June 28 daily high temperature records were set in Pueblo, Colorado (106°F), Scottsbluff, Nebraska (105°F) and Cheyenne, Wyoming (99°F).[17]
-
A daily high temperature record was set on June 29 at Gaylord, Michigan (93°F).[17]
-
Sioux Falls, South Dakota, tied its daily record-warm low temperature of 75°F on June 29.[17]
-
On July 30, hot temperatures tied daily record highs in Alpena, Michigan (99°F) and Burlington, Vermont (93°F).[17]
-
Low temperatures on June 30 were the warmest on record for June in Traverse City, Michigan (82°F) and Houghton Lake, Michigan (75°F).[17]
Climate signal #2: humidity and heat stress increase
As temperatures have climbed, so has the amount of moisture the air can hold. The northern hemisphere has had increasingly warmer and more humid summers, and the global area covered by extreme water vapor is increasing significantly.[12] The fingerprint of climate change has been found in the increase of wet bulb temperature since 1973, driving heat stress globally.[14]
Observations consistent with climate signal #2
-
To be determined as the event unfolds