Greenland Ice Sheet Melt 2007 -
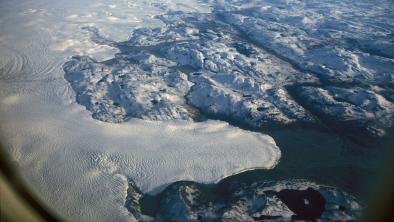
Accelerated warming of the Arctic is well-documented, and mass loss of the Greenland ice sheet has accelerated in recent decades due to increases in both ice discharge and surface meltwater runoff.
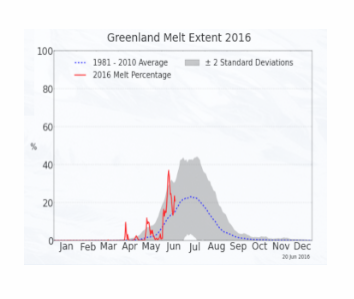
Greenland ice sheet melt has been marked by two major melt events since 2000—one in 2002 and another in 2012. The summer of 2012 was also the warmest in satellite records. In 2016, Greenland saw its warmest June day on record and the earliest start to its melt season.
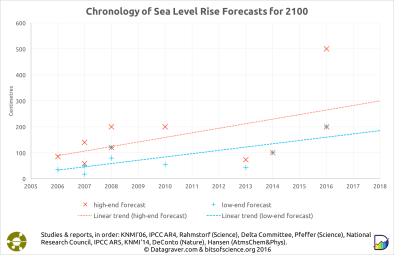
Meltwater from the Greenland ice sheet alone has a potential contribution to sea level rise in excess of 23 feet (7 meters).
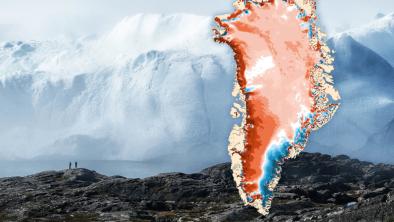
Rising air temperature linked to accelerating Greenland ice sheet melt
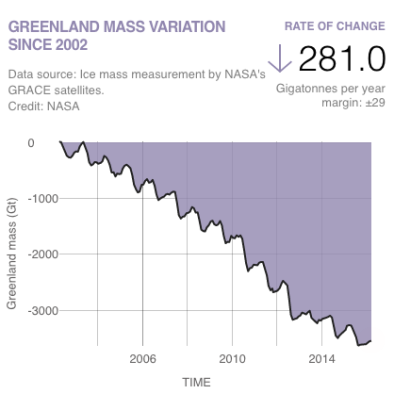
 Greenland ice sheet melt has increased from 34 gigatons per year from 1992 to 2001 (the mass equivalent of 5,000 Hoover Dams each year), to 215 gigatons (or over 30,000 Hoover Dams) per year from 2002 to 2011.[1]
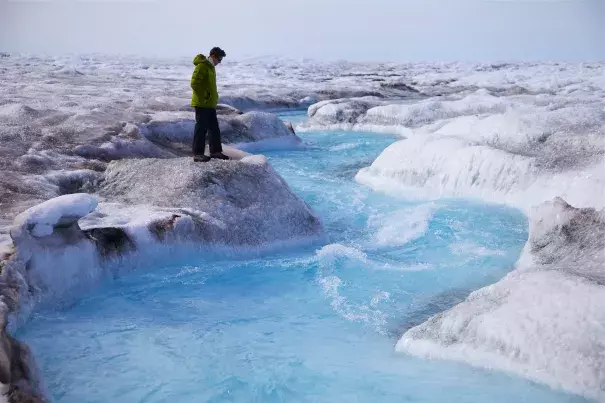
Rising air temperature (when above the freezing point) increases the amount of surface melt and (when below the freezing point) can also increase snow accumulation. In Greenland, ice melt continues to outpace accumulation from winter snow because warmer temperatures have led to increased melt and faster glacier movement at the island's edges.[1]
Temperatures over Greenland have risen significantly since the early 1990s. Satellite measurements beginning in 2000 of Greenland's ice surface temperature find an increase of approximately 1°F (0.55°C) per decade from 2000 to 2013, with the highest rate of increase during the summer at 2.4°F (1.35°C).[2] The average temperature from 1990 to 2010 is likely unprecedented in at least the past 4000 years.[3]
A September 2016 study found that Greenland’s annual ice loss is 18 gigatons higher than previously measured and part of a long-term trend rather than a brief periodic loss.[4] Using GPS data, the researchers found that between 2003 and 2013, about 270 gigatons of ice fell into the sea per year, more than seven percent higher than earlier estimates.[4]
A February 2016 study analyzing 42 marine-terminating glaciers from 1999 to 2013 found that 35 glaciers retreated, while only seven remained stable.[5] The study identified a strong, positive correlation between the glaciers' retreat and Northern Hemisphere land air temperature in the summer, suggesting the glaciers are sensitive to air temperature and surface melt.
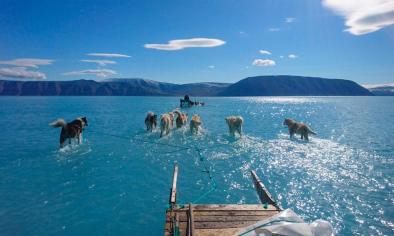
The calving of Greenland's temperature records
On June 9, 2016, temperatures in Nuuk, Greenland’s capital, reached 75°F (24°C)—the warmest temperature ever recorded in the Arctic country during June.[6] But the record only lasted one day. On June 10, the temperature in Nuuk reached 76.6°F (24.8°C).[7]
On July 30, 2013, Greenland experienced its warmest day on record for any month at 78.6°F (25.9°C) in Maniitsoq.[8]
On May 29, 2012, Greenland set a new countrywide record for the month of May when the mercury hit 76.6°F (24.8°C) at Narsarsuaq, on the southern coast.[9]
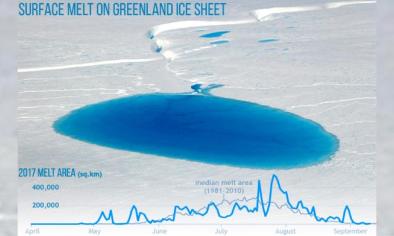
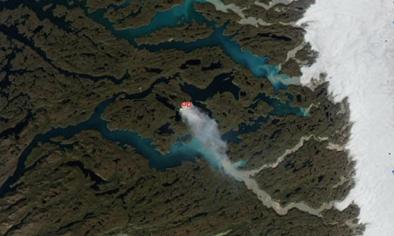
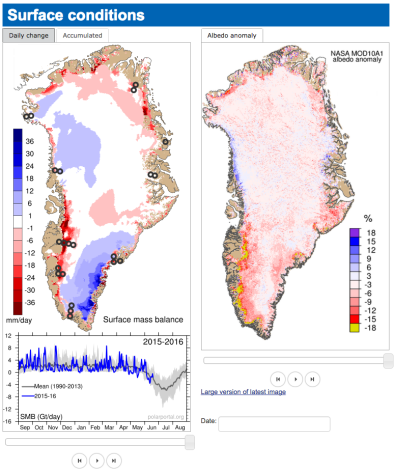
April 11, 2016 makes history as the earliest start to Greenland's melt season
The former top 3 earliest dates for a melt area larger than 10 percent—the point at which the melt season formally begins—were previously all in May (5th May 2010, 8th May 1990, 8th May 2006).[10]
During the melt event, the National Snow and Ice Data Center found that temperatures were up to 29°F (16°C) above average for that time of year. The melt was driven by warm air from the southwest that brought rain along the coast, a similar pattern to that seen during the extreme melt event in 2012 described below, when 97 percent of the surface of the ice sheet had melt.[10]
2012 was the warmest year on record for the Greenland Ice Sheet since records began in 1979
Daily surface temperatures for the whole ice sheet from June through August 2012 were more than 9°F (5°C) warmer than the daily averages during the same months for 2000 through 2009.[11] Over the highest elevations, surface temperatures were nearly 18°F (10°C) warmer than in the 2000’s decade.[11]
The combination of record warmth linked to climate change and a high pressure weather system which persisted for most of Greenland's summer in 2012 led to an area of ice sheet surface melting, unprecedented in the satellite observational record. Satellite observations revealed more than 98 percent of the ice sheet surface was melting on July 12, 2012, which was unprecedented in the 1978 present satellite record.[12][13]
Melting lasted almost two months longer than average, and it was the first year in the satellite record that the entire ice sheet experienced melt at some point in the season.[14]
Increased blocking linked to record Greenland warmth
A May 2016 study found an increase in the occurrence of atmospheric high pressure ‘blocking’ systems over Greenland since the 1980s throughout all seasons, which relates to a significantly strong warming of the Greenland and wider Arctic region compared with the rest of the world.[15]
According to the study's lead author, Edward Hanna from the University of Sheffield, “These weather systems are occurring in the area more often because of strong Arctic warming and changes in the atmospheric jet stream in recent years."[16]
Related Content