Typhoon Nepartak 2016
Beginning July 4, 2016, tropical cyclone Nepartak rapidly intensified, over the course of just 24 hours, from a 70 mph storm to a Category 4 super typhoon with 150 mph winds, peaking as a Category 5 storm with 1-minute sustained winds of 173 mph on July 6. Nepartak struck Taiwan early July 8, local time, as a violent typhoon. The eye of the storm passed over Taiwan late on July 8. The storm then hit eastern China, forcing the relocation of over 400,000. By July 10, Nepartak had dissipated over China. The rapid intensification of Nepartak was driven by favorable climate conditions, including passage over unusually warm seas with some of the highest oceanic heat content readings observed in conjunction with a tropical cyclone. There is a documented increase in the intensity of the strongest storms in several ocean basins in recent decades, including the Pacific Northwest. And warming seas are offering more energy to passing storms. Scientists are working to understand the relation between these two trends. Extreme rainfall over Taiwan and China was intense, aided in part by a warmer atmosphere, with total rainfall in some areas reaching well above 1 foot early in the storms landing in Taiwan. Ten inches of rain fell in just 4 hours in some locations in China early on July 9. Along coastlines, the reach of Nepartak's storm surge was extended by sea levels elevated by global warming.
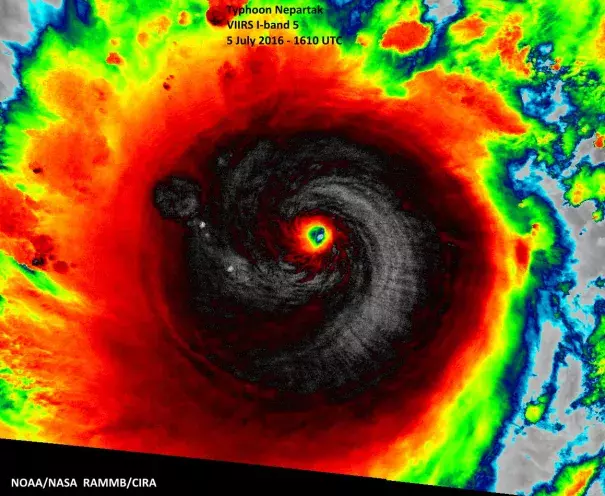
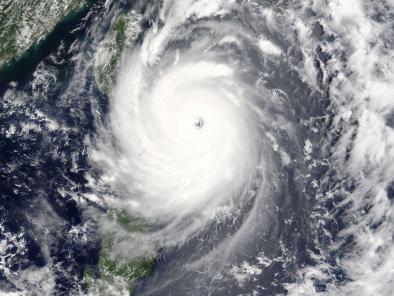
"Very warm water" fueled Typhoon Nepartak's high winds and low pressure
 The Joint Typhoon Warning Center (JTWC) reported that Nepartak's strength was "aided by low vertical wind shear, passage over very warm water, and vigorous dual-channel outflow aloft."[1] Sea surface temperatures during Nepartak's rapid intensification were upwards of 3.6°F (2°C) above the 1961-1990 average.[2] Unusually warm waters extended to great depths below the storm, "creating some of the highest oceanic heat content readings one sees for a tropical cyclone--near 150 kJ/cm."[3]
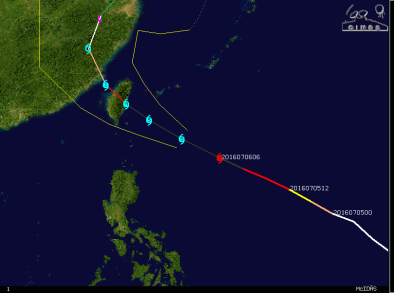
A Taiwanese buoy in the center of Nepartak's eye measured a central pressure of 897 millibars late on July 6.[4]
AccuWeather reported that Nepartak made landfall 5 miles southwest of Taitung City, Taiwan, with estimated winds of up to 125 mph (210 km/h),[5] speeds that, if sustained for at least one-minute intervals, would rank the storm as a Category 4 cyclone.
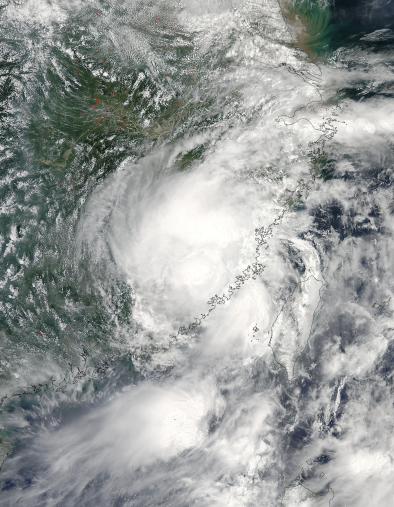
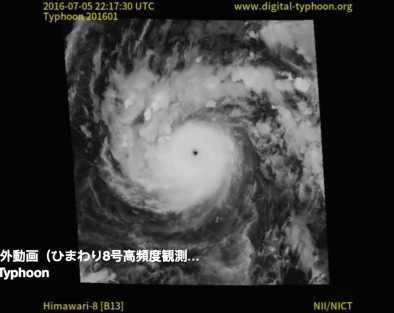
Japanese Meteorological Center satellite imagery shows the center of the storm just west of southern Taiwan and moving off toward mainland China by 02:00 UTC on Jan. 8.
Wave heights near the storm on July 8 were estimated at over 15 meters or near 48 feet.[6]
Warming seas are increasing the limits for powerful storms
Tropical cyclones are fueled by available heat. Warming seas are increasing the potential energy available to passing storms, effectively increasing the power ceiling or speed limit for these cyclones.[7] However, other factors, such as wind shear and the global pattern of regional sea surface temperatures, also play controlling roles. And the balance of these factors is not fully known.[8]
As seas warm and offer more heat energy, there has also been a global increase in the observed intensity of the strongest storms. The increase is well-documented and is consistent with models projecting the future climate, but scientists are still working to better understand the relation between these two trends.[7]
The link between warming ocean temperatures and stronger storms also may be reflected in the close correlation between observed trends in recent sea surface temperatures and observed trends in the intensity of tropical cyclones.[9][10] However, the correlation between these two trends is not fully understood and is still being investigated.
The U.S. National Climate Assessment (2014) reports that "the intensity, frequency, and duration of North Atlantic hurricanes, as well as the frequency of the strongest hurricanes, have all increased since the early 1980s." For the most recent, detailed, consensus synthesis of the current science on climate change and tropical cyclones see, "Tropical cyclones and climate change," by Walsh et al, 2015.[7]
We know that the warmer the ocean surface, the more moisture and heat that's available to intensify hurricanes and typhoons.
Dr. Michael Mann [11]
If you put more heat energy into the air, you've got more energy available to power a stronger storm.
Dr. Jeff Masters [11]
The thermodynamic limit for this hurricane wind speed must go up as you warm the climate.
Dr. Kerry Emanuel [11]
Looking forward, there is a uniform projection by climate models that the frequency of the strongest cyclones will increase. Most models also project that the overall number of cyclones will decline even as the frequency of the most powerful storms increases. However, some results point to an increase in frequency across the board.[7][12] There is a large uncertainty in these projections,[7] which represents considerable risk.
Typhoon Nepartak's intensification rate is consistent with observation that cyclones are intensifying faster
The rapid intensification of Nepartak is consistent with the observed trend indicating that tropical cyclones are intensifying faster.[13][14][15] In turn, rapid intensification has been found to be tightly linked to frequency of the most extreme storms.[16]
In the current climate the cyclones that spin up the fastest tend to be more extreme than average.
Fewer but stronger storms would likely lead to an increase in overall damages
 Damage incurred by tropical cyclones is overwhelmingly and disproportionately incurred by the most powerful storms, indicating that overall damage will increase as the climate warms.
Cyclone wind damage increases geometrically with an increase in speed.[17] A decrease in frequency would not be expected to offset the increase in damages incurred by increasing intensity. Moreover, damage escalates exponentially when storm strength crosses over the thresholds beyond which threatened infrastructure collapses.
It's the high end events that are the most destructive historically....More than half the damage that's been done in the United States by storms dating back to the middle of the 19th century has been done essentially by just eight events. So it really is the rare events, the Katrinas, the Sandys, that do the overwhelming amount of damage. Your average run-of-the-mill hurricane will do some damage and be memorable in the local place that if affects, but it doesn't really amount to a hill of beans compared to what the big storms do.
Dr. Kerry Emanuel [11]
Higher storm surge
The most important impact of tropical cyclones in coastal regions is storm surge.[7] Increases in storm surge can be due to sea level rise and increasing wind speed.[7]
Climate change has already contributed about 8 inches (0.19 meters) to global sea level rise,[18] and this has amplified the impact of cyclones by increasing baseline elevations for waves and storm surge.[19]
Small vertical increases in sea level can translate into large increases in horizontal reach by storm surge depending upon local topography. For example, sea level rise extended the reach of Hurricane Sandy by 27 square miles, affecting 83,000 additional individuals living in New Jersey and New York City.[20]
The steep terrain of Taiwan was expected to limit the ultimate reach of Nepartak's surge, but shoreline inundation was expected to be deeper.[20]
More Extreme Rainfall
 Climate change is dramatically increasing the rainfall of tropical cyclones.[21] And an increase in rainfall rates is one of the more confident predictions of the effects of future climate change on tropical cyclones.[7]
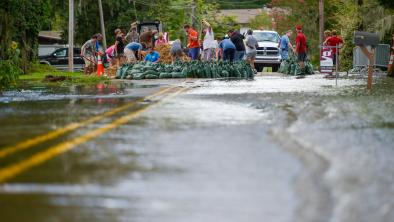
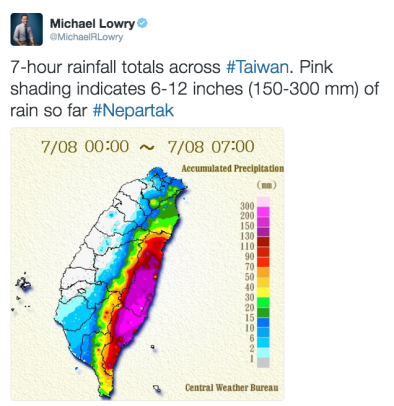
Rainfall totals from midnight to 7 AM on July 8 indicate 6-12 inches (150-300 mm) fell in Taiwan during the beginning of landfall.[22] By 9 AM several locations reported over a foot of rain. One study quantifying the effects of climate change on typhoon rainfall near Taiwan finds that modern-day typhoons yield more rainfall by about 5 percent.[23]
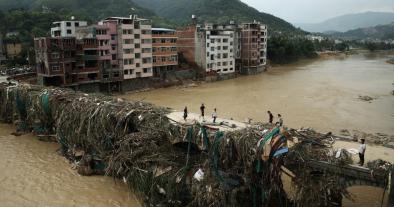
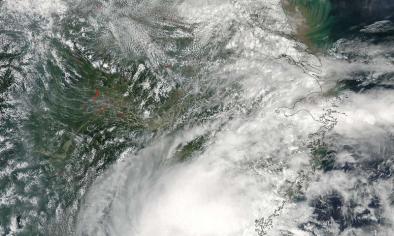
In China, 10" of rain rain fell in just 4 hours in some locations early on July 9, forcing the relocation of over 400,000.
All storms feed on a warmer atmosphere that is able to hold and dump more water. A March 2016 study analyzing data from 11,000 weather stations from 1951 to 2010 found that, globally, wet regions—including Southeast Asia—are getting wetter, at a rate of 0.3 percent per decade.[24]
Recent Northwest Pacific super typhoons point to increased storm intensity in a warming world
 The western North Pacific accounts for about one-third of all tropical cyclones worldwide and has recently witnessed a series of record and near-record strong storms (measured as the maximum surface wind speed). Typhoon Nepartak, with its 1-minute maximum sustained wind speed of 173 mph (150 knots), is the latest of these storms.[1]
November 2013’s Super Typhoon Haiyan, which became the strongest tropical cyclone in the northwest Pacific (and the Eastern Hemisphere) based on wind speed, devastated parts of the Philippines with 195 mph maximum sustained winds.[25][26] Super Typhoons Vongfong and Hagupit in 2014 rapidly developed into typhoons with intensities comparable to Haiyan, with 1-minute maximum sustained wind speeds of 167 and 180 mph.[27][28] In 2015, Typhoon Soudelor also reached 1-minute maximum sustained winds of 180 mph.[29] These events are consistent with the strengthening evidence that the frequency of the most intense tropical cyclones increases as the planet warms.[30]
Trends in intense Northwest Pacific typhoon frequencies
A number of studies have identified increasing trends in intense typhoon frequencies in the Northwest Pacific.[31][9][14][32][33]
A February 2016 study documented the tight connection between increasing ocean warmth and the increasing intensity of typhoons in the western North Pacific, finding that "the energy needed for deep convection is on the rise with greater heat and moisture in the lower tropical troposphere," and that as a result, super typhoons in the region are, "likely to be stronger at the expense of overall tropical cyclone occurrences."[31]
However, other recent modeling work projects an increase in both the frequency and intensity of typhoons in the western North Pacific.[12]
Satellite-based intensity trends since 1981 show more modest trends.[7]
A study attempting to reconcile previous discrepancies among different sources of observations on typhoon intensity in the region identifies a trend of stronger, but fewer events.[32]
Related Content