Western US Snow Drought Winter 2018
Snow melt provides a sustained source of water for over one billion people globally and is a critically important resource in the western US and in California where the Sierra Nevada snowpack supplies one-third of the state's water supply.[1] In recent years, snow water equivalent (SWE)—the amount of water stored in the snowpack—in the western US has significantly diminished.[2]
Long-term climate warming is strongly correlated with declining snow water equivalent. And shifts in stream flow throughout the American West have been driven by decreased spring accumulation and/or increased spring melt.[3] The fingerprint of warming temperatures has been found in these trends at both broad scale[4][5][6][7] and in California in particular.[8][4][9][10]
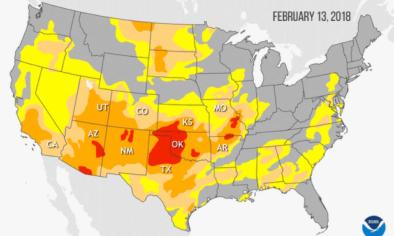
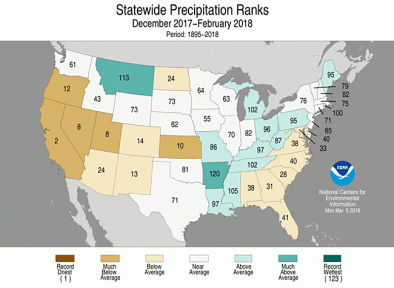
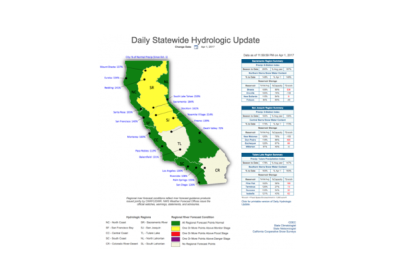
SWE is measured on approximately the first of each month in the mountains of the western US during the winter season and reaches its basin-wide maximum on approximately April. These measurements indicate the condition of water resources. By February 2018, water resources in several states were a fraction of the historical average.
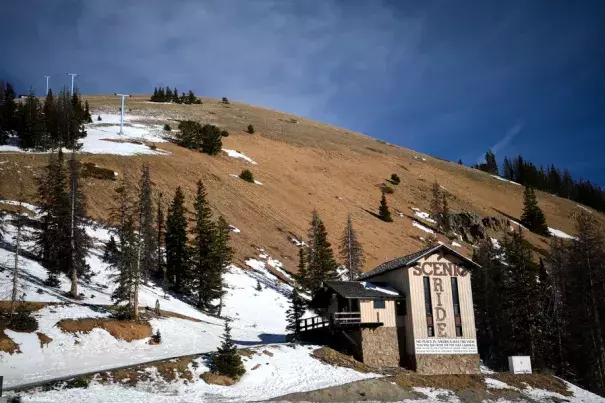
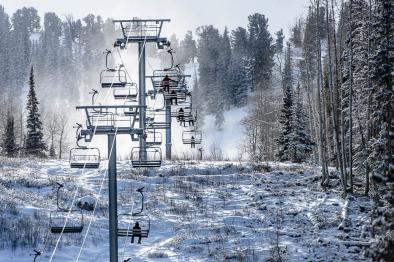
Many western states including California, Utah, Oregon, Washington, and Colorado are in the midst of a warm, dry winter.[11] In January, almost all of the open resorts in New Mexico, Arizona, Colorado, Utah, Nevada, and California were relying on man-made snow to operate.[11] These states have also experienced worsening drought in recent months.[12]


Climate science at a glance
-
Warming temperatures are already diminishing water supplies in the western US.
-
Warming temperatures convert snowfall to rainfall and enhance snow melt, which reduces snowpack.
-
Average wintertime (December-January-February) low temperatures, which are the key to forming and keeping snowpack, have risen 2.02°F across the Sierra Nevada over the last 123 years. They are warming faster than average highs.[1]
-
68 percent of California weather stations located between 2,000 and 5,000 feet experienced declines in the ratio of snow to total winter precipitation from 1949-2004.[2]
-
Human caused warming reduced California snowpack by 25 percent across all elevations and by 43 percent in lower elevations during the winters of 2012 through 2015.[3]
-
Warm conditions induced by human-caused global warming have already increased the risk of severe drought in California, even in the absence of trends in precipitation.[4]
"Warm snow drought" — how warmer temperatures increase the rain-to-snow ratio in the Western US
 Temperature and precipitation both affect water supplies. "Warm snow drought" refers to reductions in water resources due to warmer temperatures, which reduce snowpack, while "dry snow drought" refers to reductions driven by decreases in precipitation.[5]
High temperatures contributed to California's rough start to the water year. In mid-November there was a major precipitation event that brought a lot of rain, but little snow, resulting in “warm snow drought” conditions for low and middle elevation regions.
With incremental warming, significant fractions of snowfall events shift to rainfall events.[6] Rising temperatures have a larger effect at locations and elevations near the freezing level where small changes in temperature can determine whether snowpack melts and whether precipitation falls as rain or snow.[7]
Because winter temperatures in the Sierra Nevada mountains are often near the thawing threshold, a small difference in the temperature of passing weather systems often determines whether precipitation falls as snow or rain.[8]
Measuring SWE: The ratio of snowpack (measured in snow water equivalent) to overall precipitation (SWE/P) is an indicator of a temperature-driven snow-melt signal on western US snowpack.[7] The SWE/P ratio shows what fraction of current water year precipitation remains in the snowpack for any given day of the water year: the closer SWE (snow water equivalent) is to P (overall precipitation), the more water resources remain.[7]
California's winter snowpack, sensitive to temperature, is a clear signal of climate change
 Winter rain and snowfall in the mountains provides most of the water resources for California’s urban and agricultural needs. The water is stored for use as snowpack in the mountains, surface water in huge artificial reservoirs, and groundwater in aquifers. Increases in winter temperature due to climate change disrupt rain and snowfall trends in California. It increases the ratio of water that falls as rain instead of snow, causes snowpack to melt earlier, and increases the risk of extreme and prolonged drought.[4]
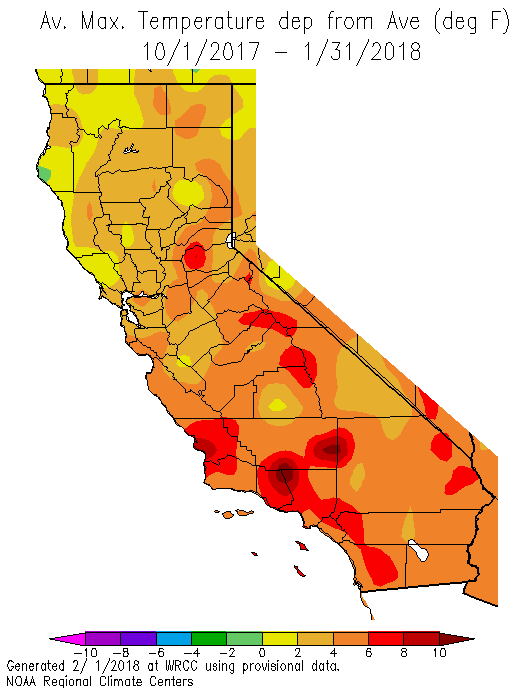
During the winter of 2017-2018, California temperatures soared. The average maximum temperature in December 2017 was the second warmest on record, 6.8°F above the 20th century average. The average low temperature during December through February has risen 2.02°F across the Sierra Nevada over the last 123 years.[1] Low temperatures are the key to forming and keeping snowpack, and they are warming faster than average high.[1]
[1]During the winter of 2015, for the first time in 120 years of record-keeping, the average minimum temperature in the Sierra Nevada mountains was above freezing.
In the last 10 or 15 years, the snowline had been marching up the mountains pretty quickly. Unfortunately, that’s the reality. It’s one of the most obvious impacts of global warming.
-- Daniel Swain, Institute of the Environment and Sustainability, Center for Climate Science[9]
 One fingerprinting study has found that during the winters of 2012 through 2015, human-caused warming reduced average annual snowpack levels in California by 25 percent across all elevations. The affect was greatest at lower elevations, which saw a reduction of 43 percent.[3]
Warming temperatures have decreased snowpack in the Sierra Nevada and moved the snow line—the elevation where rain changes over to snow—in California's northern Sierra Nevada by as much as 236 vertical feet per year between 2008 and 2017.[10] Similarly, in the southern Sierra Nevada middle elevations have been found to be prone to the largest reductions in snowmelt rates, with lesser changes simulated at higher elevations.[11]
In 2015, the April 1 snowpack measurement in the Sierra Nevada marked a record low for that date, despite seasonal precipitation coming in well above the historic low, coinciding with the warmest California winter on record. The connection between global warming and that record hot season has been formally identified.[3][12] Similarly, snowpack levels in 2017 fell far short of the record-setting snowpack levels of 1983 despite receiving record-setting precipitation in 2017.[13]
Across California, 68 percent of weather stations located between 2,000 and 5,000 feet registered a lower percentage of winter precipitation falling as snow, according to 65 years of winter precipitation data.[2]
Weather systems passing through California originate globally, and the average global increase in temperature has been 1°C, indicating significant risk that storms arriving in California may be warming and converting additional snow pack to mountain run-off. Rain-on-snow-producing atmospheric river storms are, on average, only 2°C warmer than others storm types that preserve snowpack.[8]
California experienced severe weather whiplash during the 2017-2018 winter
The season began with heavy warm rains (warm snow drought) that failed to build a heavy snowpack. Months followed with little to no precipitation (dry snow drought), driving snowpack down to near record levels.
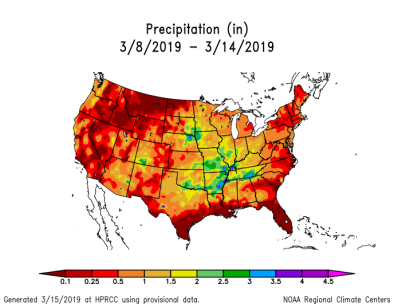
At the end of the season, conditions flipped again and March brought a series of storms significantly increasing snowpack, but still falling far short of historical averages.
The season's whiplash mirrors the long-term trend toward increasing wet/dry extremes in California, a trend fueled by climate change.[14][15][16]
State-by-state figures
Arizona
- The Agriculture Department reported that Arizona's snowpack was at just 13% of the historical median as of April 1.[17]
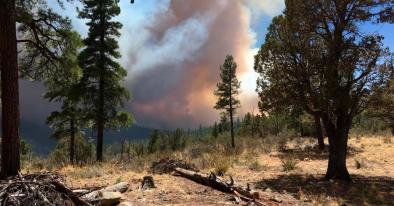
- Southwestern wildfire season kicked off with Arizona's Tinder Fire, which was started on April 27, 2018 by an abandoned illegal campfire. Within the span of a week, the fire burned 12,567 acres (19.6 square miles). A federal wildfire spokesman said the fire was worsened by the snow drought.[17]
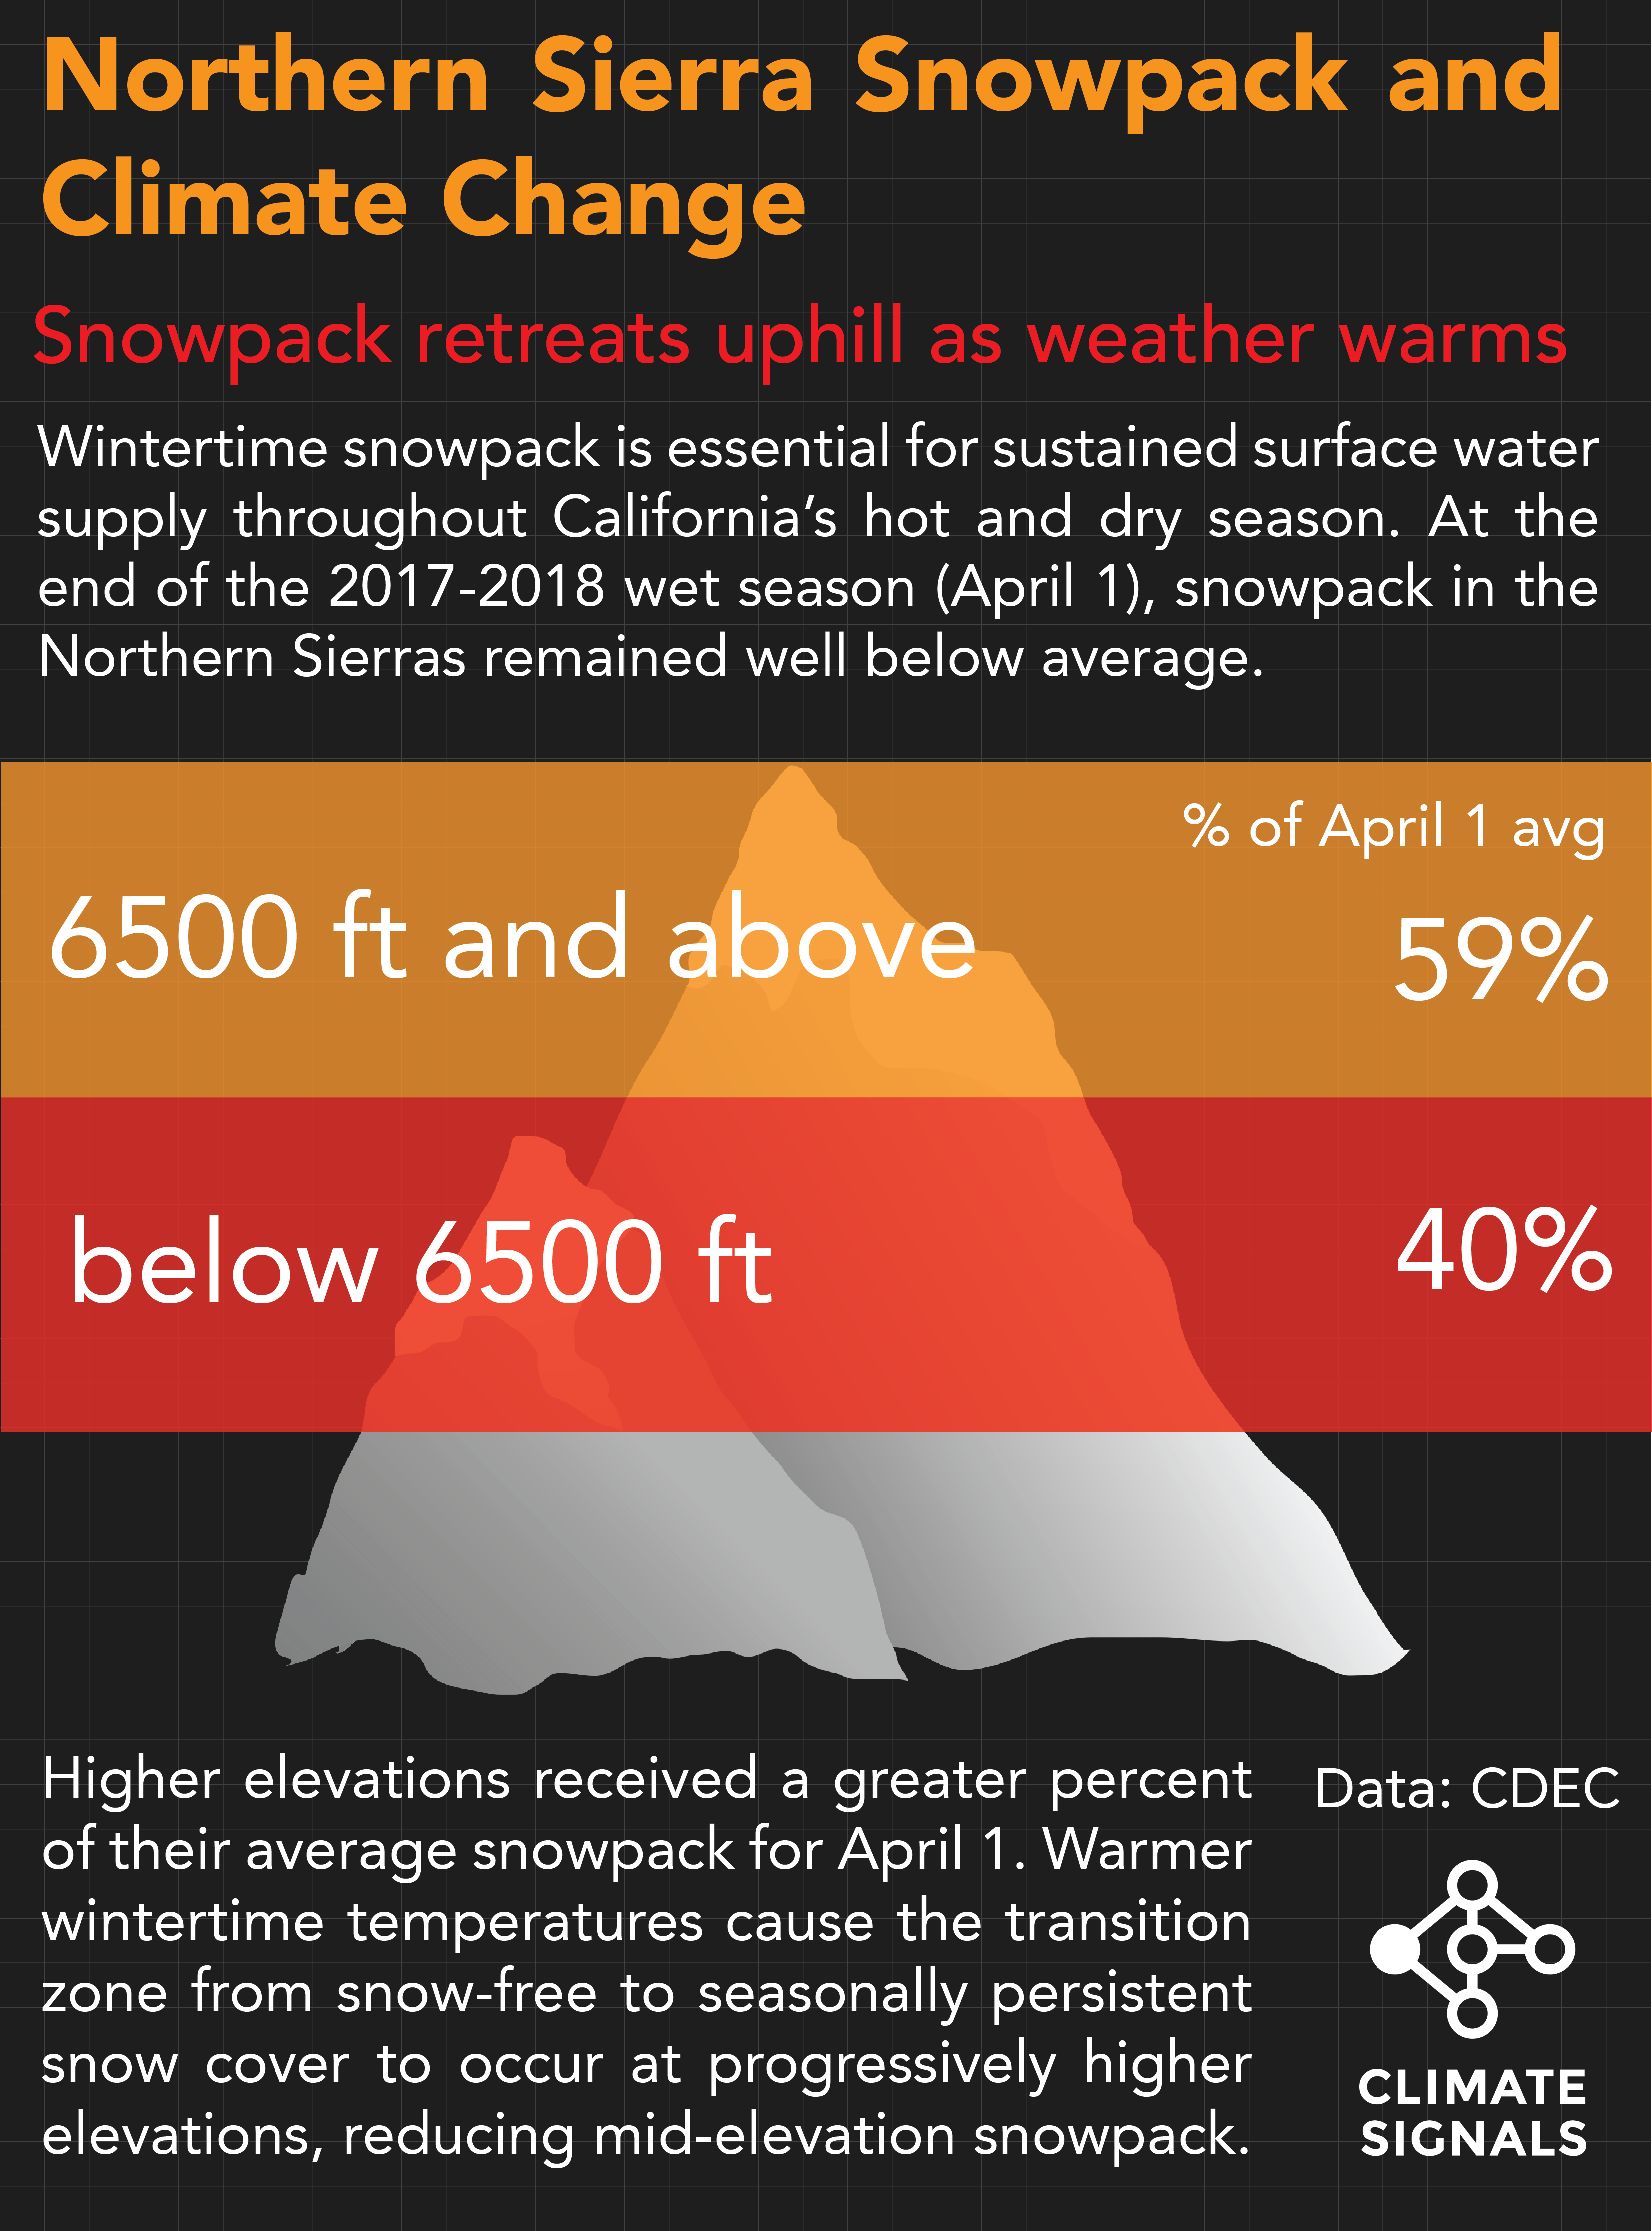
California
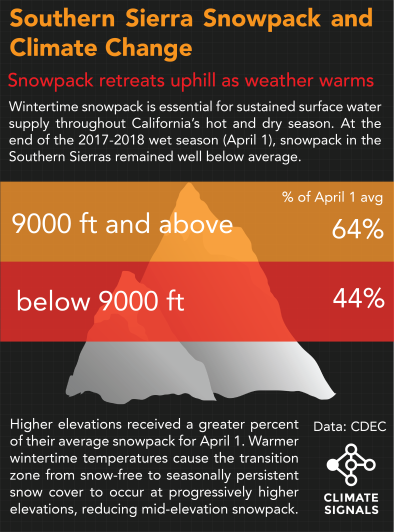
- As the end of January 2018, California's snow water content stood at only 30 percent of the historical average, with snowpack at lower elevations in particular lagging even further behind average, consistent with the long-term trend driven by climate change.
- In early 2018, about half the state fell between 5 and 50 percent of average precipitation for the winter; the other half, between 50 and 90 percent of average.[18]
- The average maximum temperatures in California during December 2017 was the second warmest on record, 6.8°F above the 20th century average. The average minimum temperature was 2.5°F above the 20th century average.
- Even the “5th Best March” on record—in terms of positive change in total water year precipitation—wasn’t enough to bring the Sierra Nevada snowpack up to average. March storms helped raise snowpack levels, but at season end, snowpack still stood at only 57 percent of the historical average. This shortfall lags even further behind the season’s total precipitation, which stands at 74 percent of the historical average.[19][20]
Colorado
- The average maximum temperature in Colorado during December 2017 was the fourth warmest on record, 6.3°F above the 20th century average. Minimum temperature was 3.8°F above average.
-
Nineteen other states depend on water from river basins that depend on Colorado’s snowpack, and the Colorado Basin River Forecast Center predicts water levels significantly below average for 2018.[21]
Oregon
- Snowpack between the elevations of 1000 and 2000 meters is the most sensitive to increases in temperature.[22]
- On January 29, SWE across Oregon ranged from 38% to 70% of normal.[23]
- As of January 28, Portland had already seen 24 days of above-normal temperatures in 2018.[24]
Utah
- At the end of 2017, Utah's snowpack in some areas was the lowest or second lowest it had been in 30 years, with southwest and southeast Utah at 19 percent and 14 percent of normal, respectively.[25]
- Most of the state had a mean daily temperature anomaly of 3-7°F (1.67-2.22°C) for the period January 1 to January 27.[26]
Global warming will continue to reduce western US snowpack
The peaks in California’s snow melt and surface runoff are likely to be more pronounced and to occur earlier in the calendar year, increasing the duration of the warm-season low-runoff period and potentially reducing surface soil moisture.[27][28]
In Oregon's Cascades Mountains, modeling suggests that an increase of 2°C over 1989–2009 would shift the average date of peak snowpack 12 days earlier and decrease basin-wide snow water storage by 56 percent.[22]
Over the next three decades in the Western US, modeling indicates that increased temperature will be the dominant factor affecting hydrologic changes, such as: decreases in spring snow pack, increases in cold-season days above freezing, and decreases in the cold-season snow-to-precipitation ratio.[29]
The models also found consistent trends indicating a decrease in April 1 snow water equivalent.[29] These changes can result in shifts toward earlier snow melt, base flow, and runoff dates throughout the region, as well as reduced annual and warm-season snow melt and runoff.[29]
Related Content