Charts: April 1, 2018 Snow Water Equivalent and Precip Totals
by California Department of Water Resources
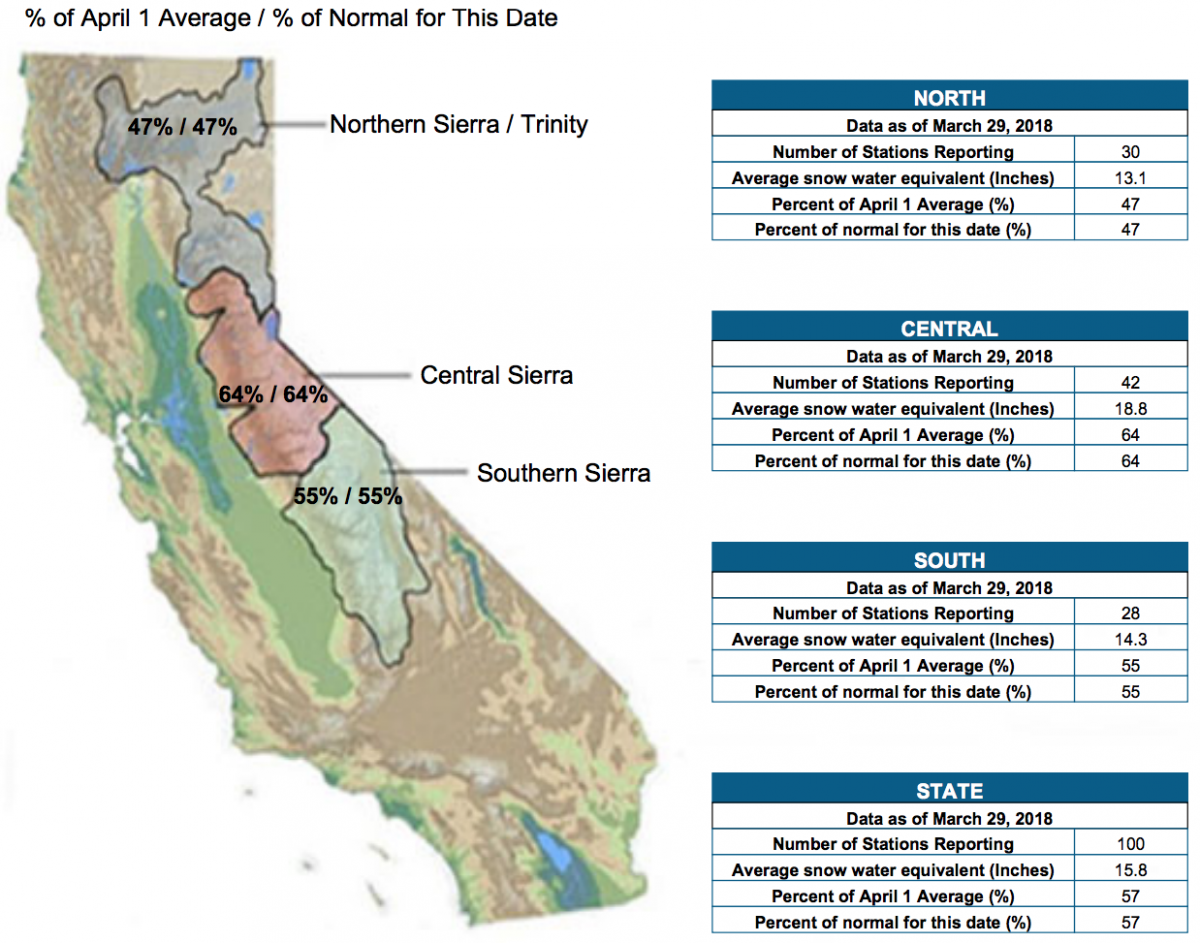
Regional SWE on March 29, 2018
At season end, snowpack still stands at only 58 percent of the historical average.
Regional precipitation indices on March 29, 2018
Total precipitation, which includes rain and snow, is at 74 percent of the historical statewide average. [This calculation is based on the weighted averages for each region: (8*.79)+(5*.78)+(6*.63)/100.]
The difference between rain and snow totals is linked to temperature. Warming wintertime temperatures cause more precipitation to fall as rain instead of snow. This has serious implications for California water supply, which depends on snowpack for sustained surface water throughout the hot and dry season.


SWE and Total Precipitation % April 1 Average Comparison (as of March 29)
| Region | SWE % April 1 Avg | Total Precip % April 1 Avg |
| Northern Sierra | 47 | 79 |
Central Sierra/ San Joaquin | 64 | 78 |
| Southern Sierra/ Tulare Basin | 55 | 63 |
| Statewide | 57 | 74 |
