Images: Warm Seas Lead to Extensive Coral Bleaching
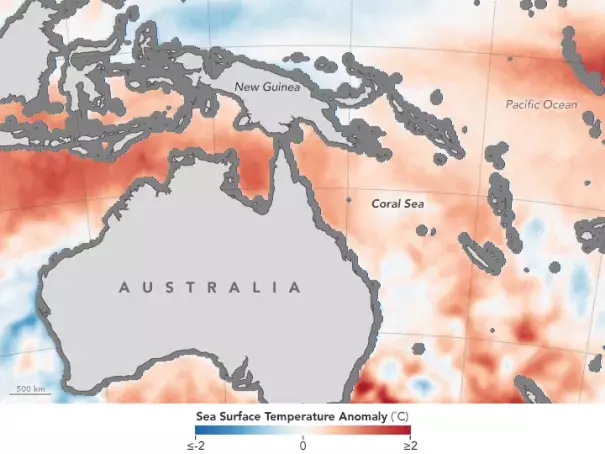
The images above and below are maps of sea surface temperature anomalies (SSTAs) in various regions over the past year. The maps do not depict absolute temperatures; instead, they show how much water temperatures were above (red) or below (blue) the long-term average for the same months from 2003 to 2012. Gray areas are too close to land and coastal shallows for a clear signal in this data set.
The map at the top of this page shows sea surface temperature anomalies for the southwestern Pacific Ocean for February and March 2016. The map below depicts equatorial Atlantic, Caribbean, and Pacific waters around the Americas in October and November 2015. The final map is a global view of SSTAs from November 2015 through February 2016, the peak of this winter’s El Niño.


