Our Record Warmth: Pointing out the Obvious
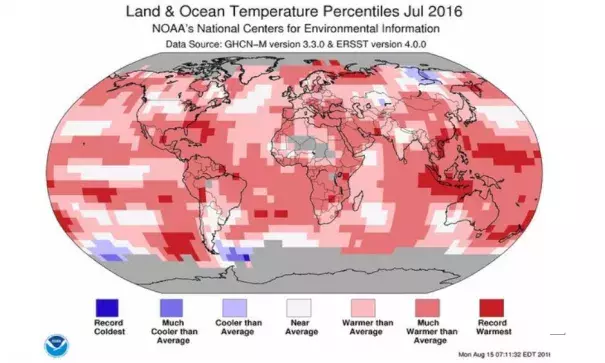
In 2016, the areas of “much cooler than average” are smaller than in 2015. August 2015 variability is in the realm of El Niño, which is typified, especially, by the bright red of the equatorial Pacific Ocean. August 2016 is in the realm of La Niña, which is typified by the cool areas in the equatorial Pacific Ocean. In this case, however, the cool, blue, areas are quite small. There are also large differences between the two years in the Indian Ocean. When the temperatures are all added up and averaged, 2016 is warmer than 2015. The strength of the 2015 El Niño and the presence of the 2016 weak La Niña temperature structure, and the fact that August 2016 is warmer, suggest that we are at the start of a time of accelerating temperature increase.
...this figure because it separates out the El Niño and La Niña cycle, which is the largest source of global variability on a year-to-year basis. The figure reveals trends in concert with the variability. It highlights the extraordinary scale of the 1997-98 El Niño, the only year of similar warmth to all of the years since 2002.

