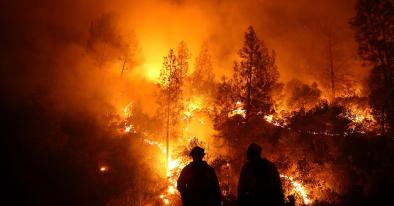
Hurricane Florence September 2018
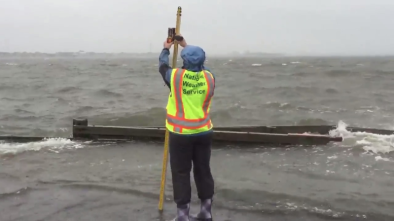
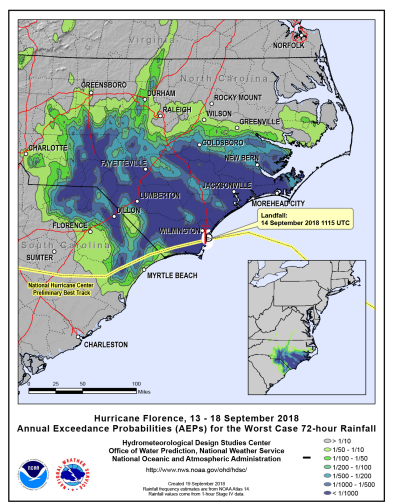
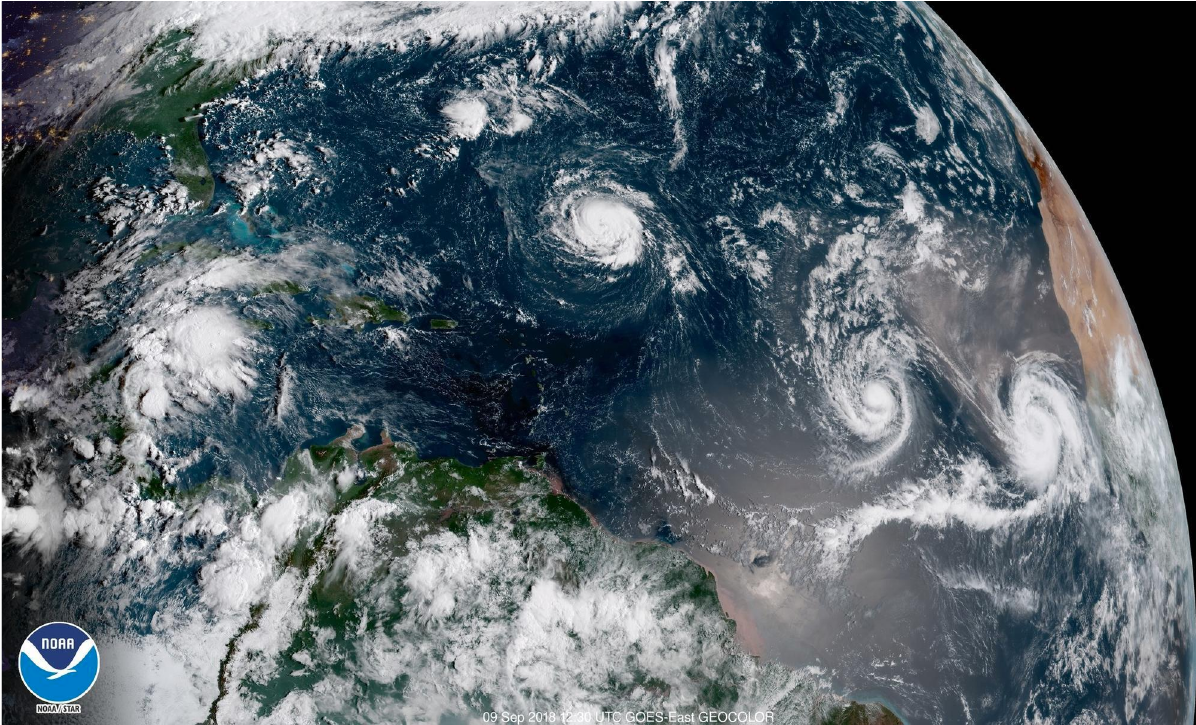
Hurricane Florence made landfall near Wrightsville, North Carolina Friday morning, September 14, as a Category 1 hurricane. Widespread rainfall totals of 20 to 25 inches, with isolated storm totals of greater than 30 inches, were recorded.[1] Elizabethtown received 35.93 inches between 2:00p EDT in September 13 and 10:00a EDT September 17.
Rainfall increased by over 50 percent in the heaviest precipitating parts of Florence due to human interference in the climate system, according to a first-of-its-kind advanced forecast attribution statement about the influence of climate change on a tropical cyclone.[2] Additionally, a rapid analysis found that sea level rise was responsible for 11,000 (20%) of the homes impacted by Florence's storm surge.[3]
Climate change affects hurricane activity and amplifies the damages in several ways including: (1) increasing the rainfall that drops during the storm, (2) increasing sea surface temperatures which in turn raises the maximum potential energy that a storm can reach, and (3) elevating storm surge, via sea level rise, which greatly extends the storm's reach along low-lying areas.
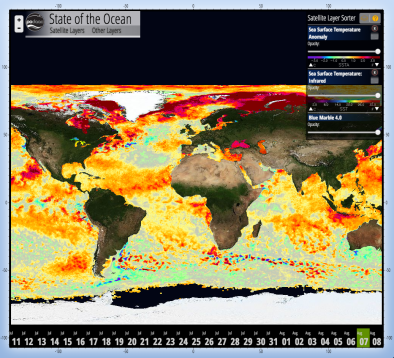
Sea surface temperatures along Florence's path were 3.6°F (2°C) hotter than normal.[4] The storm progressed slowly for several days near the US coastline, bringing extreme precipitation totals to the Southeast.[5] A similar situation contributed to the record rainfall during Hurricane Harvey in August 2017.


Climate science at a glance
 Rainfall increased by over 50 percent in the heaviest precipitating parts of the Florence due to human interference in the climate system.[1]
- Sea level rise was responsible for 11,000 (20%) of the homes impacted by Florence's storm surge.[2]
- Sea level rise, combined with coastal storms, has increased the risk of erosion, storm-surge damage, and flooding for coastal communities.
- Global warming is increasing water vapor in the air, which in turn is fueling extreme rainfall, increasing the threat of flooding driven by hurricanes.[3]
- Rising sea surface temperatures are increasing the potential energy available to passing storms.[4]
- Florence intensified rapidly as it approached the US East Coast, aided by sea surface temperatures 3.6°F (2°C) hotter than normal.[5][6]
- After landfall, Florence stalled for days[7] near the Atlantic coast due to a strong ridge of high pressure over the Mid-Atlantic that blocked its forward progress[8], amplifying rainfall totals and exacerbating flooding. A similar situation contributed to the record rainfall during Hurricane Harvey in August 2017.
- The stalling weather pattern is consistent with the weather patterns that have increasingly forced tropical cyclones to stall.[9]
- Five attribution studies found that global warming added to the deluge of rainfall dumped by Hurricane Harvey.[10][11][12][13][14]
- From 1963 to 2012, 88 percent of storm-related fatalities occurred in water-related incidents; storm surge caused 49 percent and freshwater floods due to heavy rainfall caused 27 percent.[15][16]

Climate signal breakdown
Climate signal #1: Storm Surge Increase
The most important impact of tropical cyclones in coastal regions is storm surge, which accounted for 49 percent of storm-related fatalities between 1963 and 2012.[15][16][17] Increases in storm surge related to climate change can be due to rising seas, increasing size, and increasing storm wind speeds.[17][18]
Climate change has already contributed about 8 inches (0.19 meters) to global sea level rise,[19] and this has dramatically amplified the impact of cyclones by increasing baseline elevations for waves and storm surge.[19][20][21][22] A small vertical increase in sea level can translate into a very large increase in horizontal reach by storm surge depending upon local topography. For example, sea level rise extended the reach of Hurricane Sandy by 27 square miles, affecting 83,000 additional individuals living in New Jersey and New York City[20] and adding over $2 billion in storm damage.[22]
Observations consistent with climate signal #1
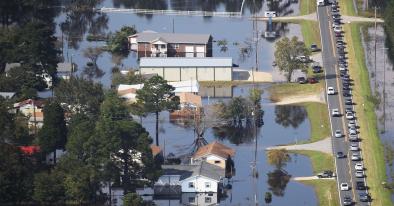
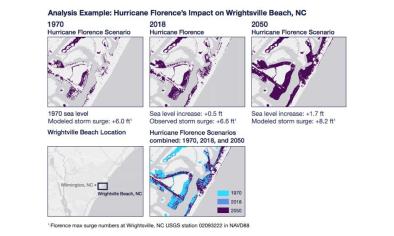
- A rapid analysis by the First Street Foundation found that sea level rise was responsible for 11,000 (20%) of the homes impacted by Florence's storm surge.[2] Tidal data shows that relative sea level off the coast of the Carolinas has risen about half a foot since 1970.[2]
- Major (category 3 and 4) hurricanes in the Carolinas have historically generated storm surges in the 15-20 foot range.[23]
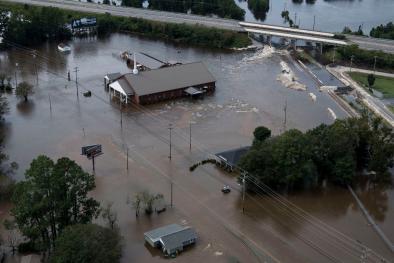
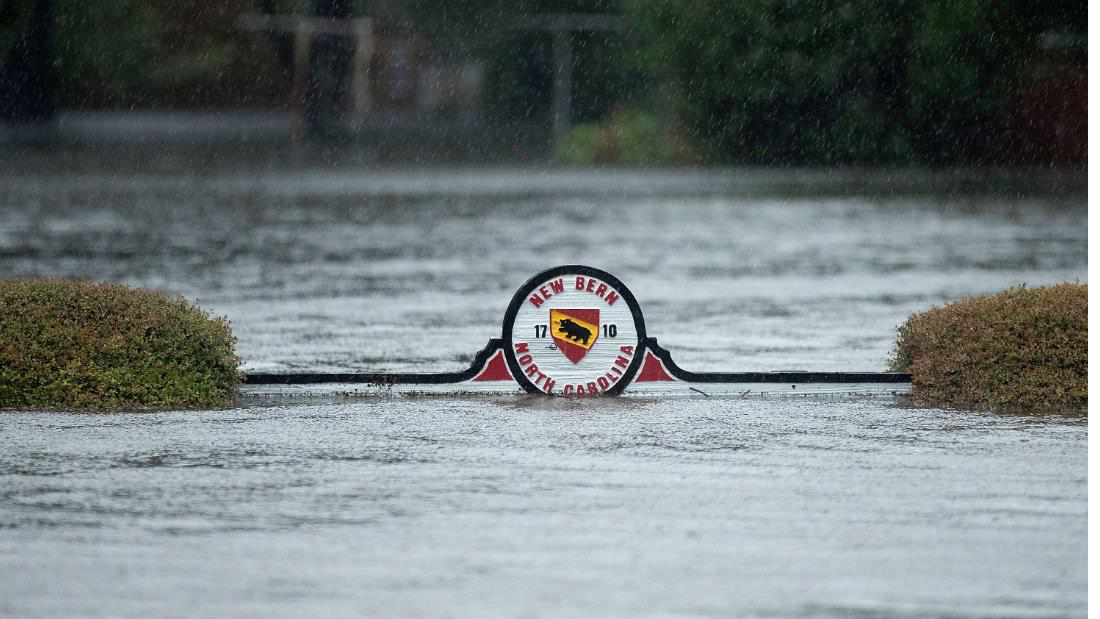
- In New Bern, North Carolina, 10 feet of storm surge flooded neighborhoods.[24]
Climate signal #2: Extreme Precipitation
Climate change is fueling extreme rainfall and dramatically increasing rainfall across many types of storms, and an increase in rainfall rates is one of the more confident predictions of the effects of climate change on tropical cyclones.[3][17]
As the global average temperature increases, so too does the ability of the atmosphere to hold and dump more water when it rains.[3] Atmospheric water vapor has been increasing.[25][26] And the observed increases have been studied and formally attributed to global warming.[19][27][28]
Five attribution studies found that global warming added to the deluge of rainfall dumped by Hurricane Harvey.[10][11][12][13][14]
Observations consistent with climate signal #2
- Rainfall totals of up to 35.93 inches were recorded in North Carolina.
- Climate change significantly increased rainfall by over 50 percent in the heaviest parts of Hurricane Florence, according to a first-of-its-kind advance attribution study.[1]
- Twelve spots preliminarily topped North Carolina's tropical cyclone rainfall record of 24.06 inches set during Hurricane Floyd in 1999.[29]
- Six spots preliminarily topped South Carolina's tropical cyclone rainfall record of 18.51 inches from Tropical Storm Jerry of 1995.[30]
- According to preliminary data from USGS:
Climate signals #3 and #4: Sea Surface Temperature Increase and Intense Atlantic Hurricane Frequency Increase
Tropical cyclones are fueled by available heat. Warming seas have increased the potential energy available to passing storms, effectively increasing the power ceiling or speed limit for these cyclones.[17][32] In parallel there has been a global increase in the observed intensity of the strongest storms over recent decades.[33][34]
The fingerprint of climate change has been documented in tropical cyclone activity. And for the Atlantic in particular, the U.S. National Climate Assessment reports that in the Atlantic human factors have "contributed to the observed increase in hurricane activity since the 1970s.”
Observations consistent with climate signals #3 and #4
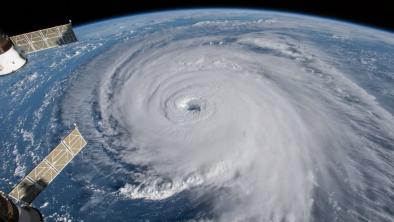
- Sea surface temperatures were up to 3.6°F (2°C) hotter than normal along Hurricane Florence's path, allowing for further strengthening, according to the National Hurricane Center.[5]
- Conditions were so favorable to hurricane development on September 8 that the NHC made their most aggressive rapid intensification forecasts since at least 1998 for an Atlantic storm.[8]
Climate signal #5: Atmospheric Blocking Increase
Waves in the jet stream can stall in place (instead of moving eastward), leading to blocking and persistent weather patterns that fuel the intensity and duration of rainfall events.
A study from March 2017 found that climate change is altering large-scale weather patterns, such as the jet stream.[35] These changes can dramatically amplify extreme weather events, such as extreme rainfall, during the summer.[35]
A parallel study has tentatively documented a general slowdown of atmospheric summer circulation in the mid-latitudes.[36] This is a consequence of the disproportionally strong warming in the Arctic; it can make weather systems move less and stay longer in a given location – which can significantly enhance the impacts of rainfall extremes.
A 2018 study by Jim Kossin finds that tropical cyclones world wide have increasingly stalled, their forward speed decreasing, over the past 70 years, due to a slowing in steering patterns attributed to global warming.[9]
"If Florence stalls as forecast, it will be an example of what we have been seeing more of over the past 70 years."
- James Kossin, NOAA Cooperative Institute for Meteorological Satellite Studies University of Wisconsin-Madison
Observations consistent with climate signal #5
- Florence did indeed slow down dramatically for several days near the US coastline, bringing extreme precipitation totals to the Southeast.[37][7]
- The storm was moving at a pace of just 5 mph for part of that time.[7]
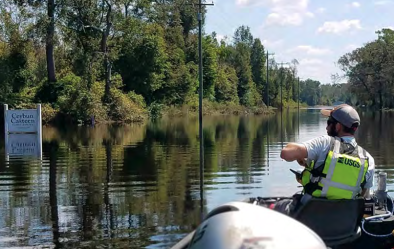
- Rivers were flooding up to a week after landfall as runoff continued to pour into them.[38]
Related Content