Extreme El Niño 2015 - 2016
The 2015-2016 El Niño officially tied the 1997-1998 event as the strongest El Niño on record, the National Oceanic and Atmospheric Administration announced the first week of January 2016.
Research has shown that the exceptional warmth observed during the event was unlikely to have occurred entirely naturally, and appears to reflect an anthropogenically forced trend.[1]
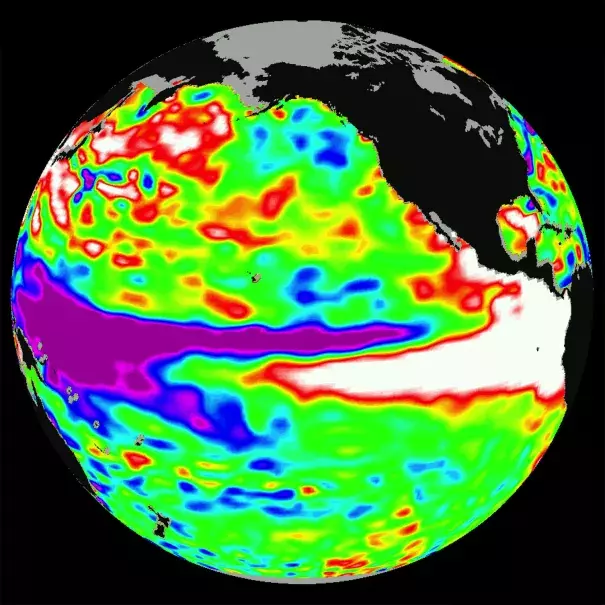
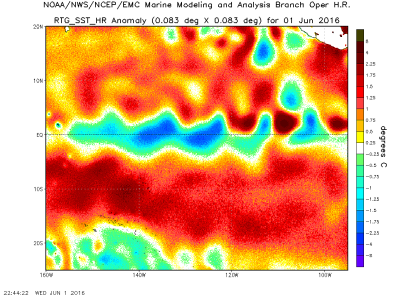


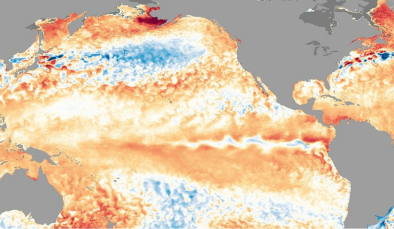
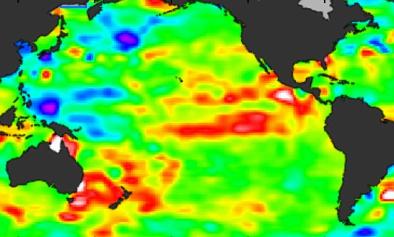
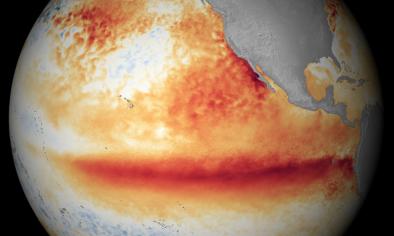
Central Pacific warmth during the 2015-2016 El Niño was unprecedented
The 2015-2016 El Niño was not wholly unexpected. For years, the oceans have absorbed most of the added heat trapped by greenhouse gases. What we saw during the 2015-2016 El Niño was some of this heat reemerging.
The strength of an El Niño is measured by the surface temperature of the Pacific Ocean, and from October through December 2015, the water temperature was 2.3°C above average, tying the temperature departure during these months for the 1997-1998 event.
A 2017 study found that the warmth in the central equatorial Pacific was unprecedented in nearly all SST reconstruction datasets, and the warmth seen in the eastern equatorial Pacific could be expected roughly once every 40 years.[1]
Extreme El Niños and global warming
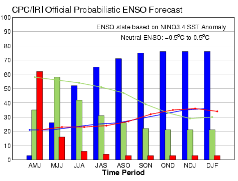
Predicting how El Niños evolve in a warming planet is extremely challenging. The factors involved are far from well understood. However, the most recent model projections tell us that we may expect extreme El Niños (and La Niñas) to happen more frequently. Records tend to be broken when natural variation runs in the same direction as climate change, and this El Niño event moved along on a record-breaking path.
Extreme El Niño Impacts
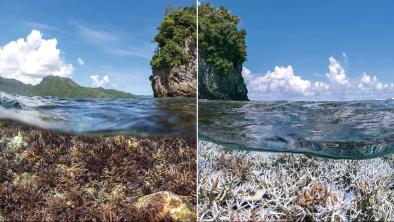
- The combination of El Niño on top of the steady upward trend in global warming instigated the third-ever global coral bleaching event, which lasted from 2014 to 2017.[2] It was the first global coral bleaching event to span multiple calendar years.[3]
- Global warming also supercharged the 2015-2016 El Niño to drive a record-breaking storm season, with 23 Category 4 and 5 storms in the Northern hemisphere, far above the old record of 18 set in 1997 and 2004. Hurricane Patricia was the strongest hurricane ever measured, by some measurements.
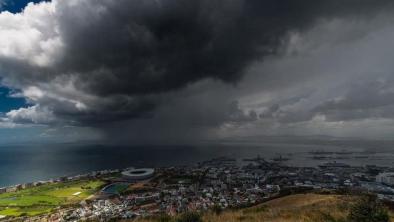
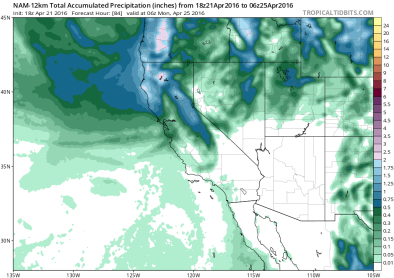
- Global warming charges El Niño rains extra precipitation. A warmer atmosphere holds more moisture, and just as a bigger bucket dumps more water when it empties, climate models project that El Niño rains are likely to dump more water wherever they ultimately fall.
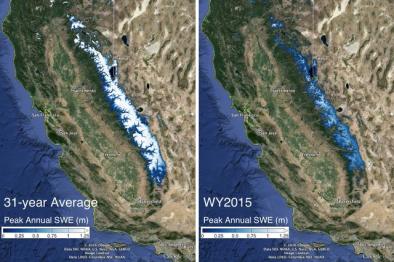
- For many other areas of the world, however, El Niño means drought. And here, too, climate change is likely to intensify the event, bringing hotter temperatures that dry out soils and melt snow packs. In California, the impact of higher temperatures on the state’s critical Sierra Nevada snowpack might offset some of the hoped-for precipitation brought by El Niño.
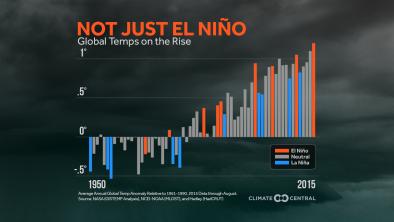
- El Niño helped make 2015 the planet's hottest year on record (up to that point in time; the following year, 2016 became the new hottest year on record).[2]
- A multi-year drought in the Horn of Africa may have been intensified by El Niño, as the phenomenon typically brings drier conditions to much of Ethiopia[4] and northern Uganda.[5]
There are features of the climate system that can complicate the complex work of predicting El Niño-driven global weather patterns. One such example is the “the cold blob” in the north Atlantic that appears to be caused by ice water running off the melting Greenland ice sheet and is affecting ocean currents.
Changes to El Niño increase risk in the United states
Predicting exactly what this El Niño will do to extreme weather in the United States is challenging. We are now in uncharted territory. The 2015-2016 El Niño was not only warmer, but its effect reached much further west than El Niños in the past. It may also be connected to record-breaking ocean temperatures along the west coast of Baja and further north.
The regional features of our climate system are becoming harder to predict due to climate change. Disaster usually strikes when a threshold is crossed. Our economic infrastructure has been built to withstand the known historical extremes; similarly, our natural ecosystems have evolved to cope with those same extremes. When faced with new extremes, however, these systems often collapse. The rising unpredictability of regional changes like El Niño magnifies the risks we face from extreme events.
Related Content