Peru Floods 2017
Since January 1, 2017, Peru has witnessed several episodes of extreme downpours, totaling up to 10 times more rain than average, leading to devastating flooding and landslides in Peru's usually semi-arid coastal region and the Andean highlands. The precipitation is clearly and directly linked to extremely warm water off the coast of Peru, which scientists in Peru have tied to a rare "coastal" El Niño event. In Peru's local climate a high percentage of total annual precipitation can fall in just a few days, causing floods or landslides. However, there is evidence that global warming may have helped to amplify the extreme rainfall. These downpours are consistent with the global trend toward heavier precipitation, a trend firmly attributed to climate change. Warmer oceans offer more moisture to passing storms, and warmer air can hold and dump more moisture. Global warming has warmed seas generally and it is possible that this trend may have also bumped the strength of the "coastal" El Niño event. Evidence also suggests that extreme weather events associated with climate variability may be increasing in the area. The heavy rains in 2017 arrived shortly after the country experienced severe drought and wildfires due to the combination of global warming and the after-effects of El Niño. In recent decades, several extreme hydrological events occurred in the Andean-Amazonian region and climate change may be polarizing conditions in Peru, amplifying the flood/drought pattern that has repeatedly visited the country in recent years.


Climate science at-a-glance
- There is evidence that climate change may be amplifying the extreme rainfall driving flooding in Peru.
- Increasing extreme precipitation is an observed global trend firmly attributed climate change,[1][2] and available data for the Peruvian region suggest this trend may also be taking place across Peru.[3][4]
- Climate models project an increase in average rainfall and heavier downpours throughout Peru.[4]
- A warmer atmosphere holds and dumps more moisture when fully saturated.
- And warmer seas offer more moisture and heat to intensify storms and feed downpours.
- Climate change can contribute to both flood and drought in the same region, polarizing climate conditions, amplifying weather whiplash.
- While Peru has experienced major coastal El Niños twice before in the last 125 years, El Niños more generally have become significantly more variable and intense over the twentieth-century compared to prior centuries, and models suggest that El Niños become more frequent and/or intense in a warming climate. The very large uncertainty regarding the effect of climate change on El Niño represents significant risk.
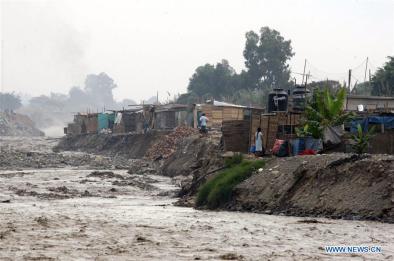
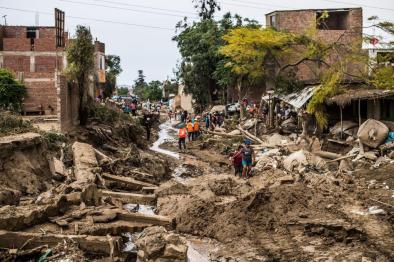
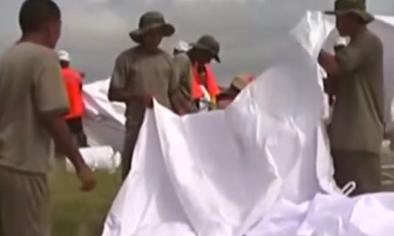
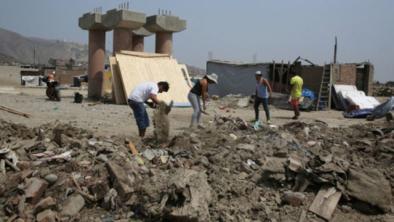
Extreme rainfall devastates Peru
According to the Peru's national meteorological agency, rainfall accumulations exceeding 2 in (50 mm) daily have been recorded for several weeks, leading to flooding and landslides.[5] Maximum 24-hour rainfall accumulations of 3.7 in (94.8 mm) were recorded in Lambayeque, Jayanca on March 14.[5] Data collected by NASA's Global Precipitation Measurement instruments on March 20 along the portion of the storm front that ran above the coastal waters southwest of Peru reported extreme rainfall rates of greater than 5.4 inches (137 mm) per hour.[6]
Rain monitoring reports released by Peru's Ministry of the Environment (Ministerio del Ambiente) from January through March indicate that several regions have recorded 24-hour rainfall totals in the highest category — "extremadamente lluvioso," or "extremely rainy." This category for observed 24-hour rainfall for a given region is in the 99th percentile, or occurs less than 1 percent of the time for rainy events. (See here fore Peru's rainfall recurrence methodology.)
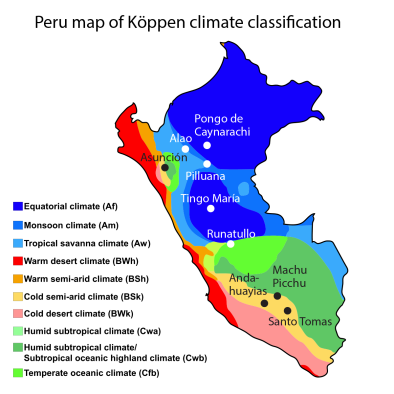
 24-hour "extremely rainy" values were observed at the following locations:[7]
- San Martin (Pilluana station) — 3.6 in (92.2 mm) (March 23)
- Cajamarca (Asunción station) — 1.9 in (48.7 mm) (March 23)
- Cusco (Santo Tomas station) — 1.5 in (38.7 mm) (March 23)
- Cusco (Machu Picchu station) — 2.5 in (62.8 mm) (February 27)
- Junín (Runatullo station) — 1.3 in (33 mm) (February 27)
- Huánuco (Tingo María station) — 3.0 (77.1 mm) (February 27)
- San Martin (Pongo de Caynarachi station) — 4.0 in (102.6 mm) (February 15)
- San Martin (Alao station) — 2.9 in (72.7 mm) (February 15)
- Apurímac (Andahuayias station) — 1.3 in (31.8 mm) (January 18)
Trends and Forecast
A March 2016 study analyzing precipitation trends between 1974 and 2004 in the nearby Mantaro River basin, or central Andes region of Peru, finds that the number of rain stations showing an increase in daily precipitation intensity during the heavy precipitation period of January through March is much higher than those with negative trends.[3] The study also states that a high percentage of total annual precipitation can fall in just a few days, causing floods and landslides, and large economic losses.[3]
A 2011 World Bank report shows it's likely that climate change causes rain intensification in Peru.[4] It models annual as well as five-day precipitation events for the near future (2015-2039) and projects an increase in average rainfall and heavier downpours throughout Peru, leading to an increased likelihood of floods and reduced stability of stream flows.[4] The largest rainfall intensification is found over the northwestern coast and the Andean Cordillera.[4]
More Event Detail
The rainy season in Peru runs from December into April, but 2017 is already likely one of the wettest years on record for San Miguel in the Piura province.[8] Around 10 inches of rain have fallen since January 1, compared to the the entire rainy season average, which usually totals just two inches of rain. Farther inland in the Piura region, a weather station in Morropón recorded 43 inches of rain since the start of 2017. At this point of the year—early March—Morropón’s average rainfall is about 4 inches. Rainfall totals in 2017 are 10 times higher than normal.[8]
Farther south, the heaviest rains fell in the month of January.[8] At Chuquibamba in the Arequipa province, around 8 inches of rain fell in January, more than double the average.[8] Totals at the beginning of March are around 12 inches, 4 to 5 inches above the average seasonal rainfall total, with a month still to go.[8]
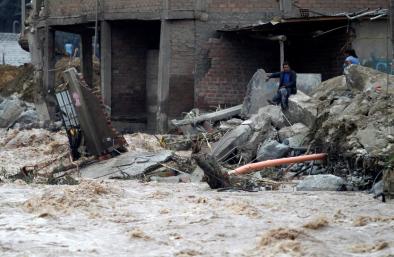
Reacting to the floods on March 16, Peruvian president, Pedro Pablo Kuczynski stated:
We are confronting a serious climatic problem.[9]
The combined impact of the rains and preceding drought could shave up to 0.6 percentage point off economic growth, according to the financial analysis company, 4Cast.[10]
Extra water vapor in the atmosphere is making storms wetter
A warmer world is also a moister one, because warmer air can hold more water vapor.[11] Global analyses show that specific humidity, which measures the amount of water vapor in the atmosphere, has increased over both the land and the oceans.[11] During the past 25 years, satellites have measured a 4 percent rise in atmospheric water vapor that is in line with the basic physics of a warming world and computer modeling of our current climate.[12][13]
In the tropics, where precipitation is largely convective (which means it's based on the transfer of heat), the intensity of rainfall tends to be more sensitive to temperature changes.[1]
The number of record-breaking rainfall events globally has significantly increased in recent decades, and the fingerprint of global warming has been documented in this pattern.[1][2]
The signal of increased extreme precipitation can be difficult to identify in tropical areas, and some regions have not witnessed it. But evidence suggests this pattern has been witnessed in Peru.[3]
Extreme drought to extreme flood: weather whiplash hits Peru
The heavy rains in January 2017 arrived just after Peru finished one of its driest years in two decades, conditions that helped to fuel extreme wildfires in the Andean-Amazonian region.[14]
We've rarely seen this kind of rapid and quick change in climatic conditions.
Juber Ruiz of Peru's Civil Defense Institute[10]
Climate change in Peru may be contributing to weather whiplash—a term for a rapid switch from one type of extreme weather to another, such as extreme drought-flood cycles. The World Bank 2011 modeling study, in addition to identifying a likely intensification of rainfall in Peru, found climate change also likely leads to an increased number of days without rain, which increases drought risk.[4]
Climate conditions in Peru may be polarizing further, amplifying the flood/drought pattern that has repeatedly visited the country over the last several decades. Overall dryness has increased, due to warming temperatures which dry out soils and amplify drought conditions. This in turn decreases flood risk. However at the same time, as rainfall is concentrated into extreme precipitation events, flood risk increases. These trends combine to drive weather toward extremes at either end of the drought/flood spectrum.
Observational data indicates an increase in the frequency of extreme hydrological events in the Amazon basin since the end of the 1980s, which is consistent with the science suggesting that extreme droughts may be becoming more frequent and intense because of climate change.[15] In recent decades, several extreme hydrological events occurred in the Amazon region.[15] Among them, three severe droughts have occurred in 2005, 2010, and 2016, which were harmful for agriculture, ecosystems and caused massive forest fires.[15] In all these cases, dry conditions were particularly intense in the western Amazon (which overlaps with regions that experienced fires in 2016 and floods in 2017).[16][15] Heavy flooding was also reported in the central part of the Amazon basin in 1999 and 2009.[15]
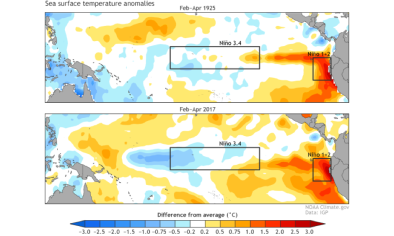
Coastal El Niño and increased ocean temperatures
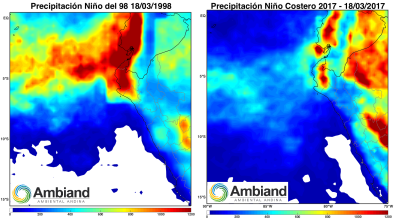
The ocean was warmer in February in some locations than it was during the 2015-2016 El Niño, and by mid-March, coastal sea surface temperature anomalies matched those observed during the record 1997-1998 El Niño event.[8][17] This led the Peruvian government to declare a "coastal" El Niño—not to be confused with El Niño events in the central/eastern Pacific Ocean. "Coastal" El Niños of this magnitude have been seen twice before in the historical record, nearly a century ago in 1925 as well as in 1891.[9]
The weather conditions in Peru in early 2017 have been “extremely unusual," according to Peruvian weatherman Abraham Levy. Levy attributes the storms and flooding to the “atypical” warming of sea surface temperatures off Peru’s northern coast.[9]
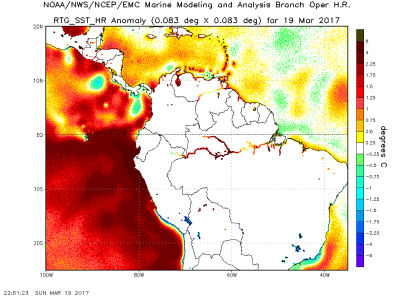
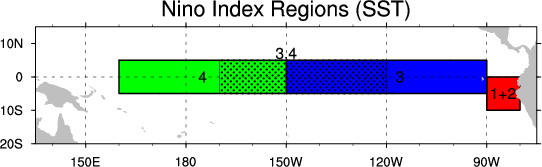
Sea surface temperatures in the Niño 1+2 region off the coast of Peru (pictured in red below) rose rapidly since the start of 2017, from near average at the start of the year to as much as 9 to 11°F (5 to 6°C) above average in March.[17]
 As for how observed rainfall totals during the 2017 "coastal" El Niño compare to those during the major 1998 El Niño, Levy notes:
Although still lower than 1998 at this time of the year, this is a huge event bringing total yearly rainfall anomalies over 1000% in selected big northern coast cities like Piura. Pockets of +1000mm are conspicuous in the 2017 data. Keep in mind, this area is a desert![18]
“We’ve had these kinds of El Niños as long as we have historical data, so it’s very difficult to link climate change or even global warming to these events,” said Levy.[9]
Other scientists say a global trend of rising sea temperatures was likely to have contributed to the recent storms.[9]
According to Mojib Latif—a professor of oceanology and climate dynamics at GEOMAR, the Helmholtz Center for Ocean Research in Kiel, Germany:
Sea temperatures off the coast of Peru are slowly warming. So the question is whether or not global impacts are having an influence here on the climate of South America. What we can say is that El Niños have become more frequent and also stronger in recent decades. Whether this is already a trend or not is hard to say but some climate models actually project that this is exactly what's going to happen in response to climate change.[19]
Alternatively, some scientists say the warm waters off the coast of Peru could be the re-establishment of an El Nino event that will continue over the next year. Gerald Meehl of NCAR notes that this pattern is also consistent with the transition of the IPO to positive around 2014 accompanying above normal tropical Pacific SSTs on the decadal timescale.[24]
What’s the relationship between El Niño and climate change?
The El Niño Southern Oscillation (ENSO) is one of the most important fluctuations that affects global surface temperature, transferring heat between the ocean and atmosphere.
El Niño is a natural phenomenon, but observational data shows they are getting stronger. There were three record El Niños since 1980: 1982/1983, 1997/1998 and 2015/2016. Most models predict that El Niños intensify in response to global warming. A May 2015 modeling study even simulates "Super El Niños" in response to enhanced atmospheric CO2.[20]
A 2013 study analyzing 7,000 years of fossil coral records shows that El Niño and La Niña events have become significantly more variable and intense over the twentieth-century.[21] This finding suggests El Niño may be getting stronger as the level of carbon dioxide in the atmosphere rises.[21]
Furthermore, a 2015 literature review of ENSO and climate change concludes that extreme El Niño events are likely to happen more often as the climate warms.[22]
However, whether we can attribute bigger El Niño events and in particular more intense "coastal" El Niños to climate change is not yet certain. NOAA scientist Michael McPhaden recently reviewed in Nature the complex relationship between climate change and ENSO. According to McPhaden, “How El Niño and La Niña events might change in response to climate change is one of the most compelling questions in today’s climate research today.”[23]
Related Content