Headline
16 of the Craziest Weather Events We've Seen So Far in 2016
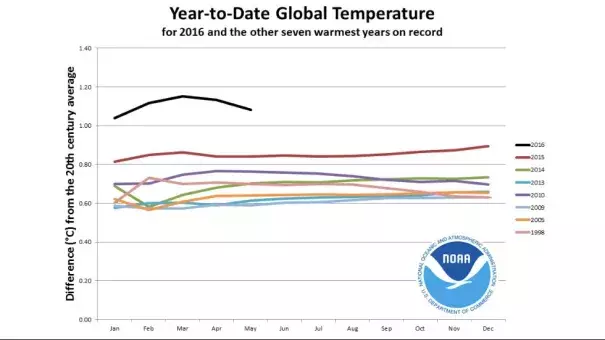
Image: NOAA
Monthly heat records for the globe have fallen by the wayside in each of the first five months this year. There is no better way to illustrate this than with the eye-popping graph above.
The black line is the departure from average temperature for the entire surface of the earth January-May 2016. Also shown is the departure from average for the seven warmest years on record. As you can see, it's not even close, as the period from January-May 2016 has been far and away warmer than those years to date.
In January, February, March and April, the previous monthly record was crushed by the new record in 2016.
A record strong El Niño likely played a role in fueling the incredibly mild temperatures we saw to start the year
Related Content
Headline
Jan 10, 2017 | Associated Press
US had near record heat, costly weather disasters in 2016
Headline
Jan 4, 2017 | Climate Central
There Were a Crazy Number of Record Highs in 2016
Headline
Dec 8, 2016 | Climate Central
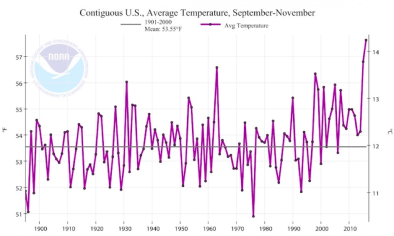
Record-Warm Autumn Solidifies 2nd-Hottest Year for US
Headline
Dec 8, 2016 | Category 6
Autumn 2016: Warmest in U.S. Weather History
