2016: A historic year for billion-dollar weather and climate disasters in U.S.
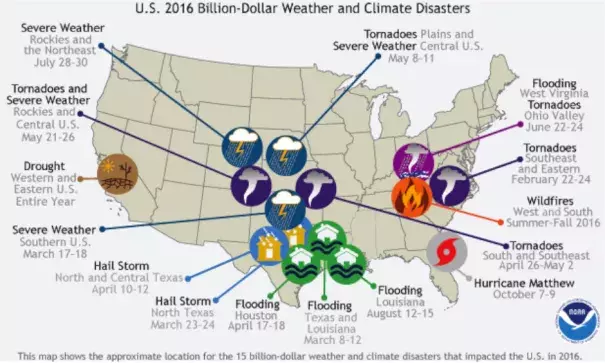
The year 2016 was an unusual year, as there were 15 weather and climate events with losses exceeding $1 billion each across the United States. These events included drought, wildfire, 4 inland flood events, 8 severe storm events, and a tropical cyclone event (see map below). Cumulatively, these 15 events led to 138 fatalities and caused $46.0 billion in total, direct costs. The 2016 total was the 2nd highest annual number of U.S. billion-dollar disasters, behind the 16 events that occurred in 2011.
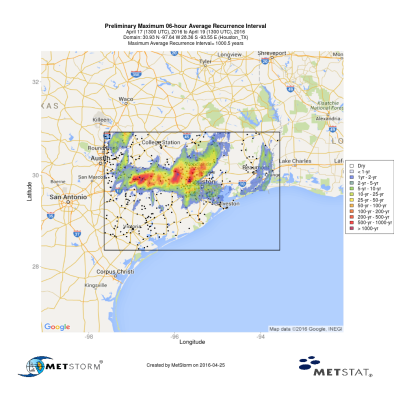
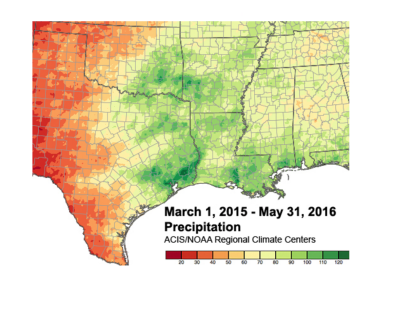
Perhaps most surprising were the 4 separate billion-dollar inland flood (i.e., non-tropical) events during 2016, doubling the previous record, as no more than 2 billion-dollar inland flood events have occurred in a year since 1980. Three of these flood events were clustered in Louisiana and Texas between March and August, collectively causing damage approaching $15.0 billion. This is a notable record, further highlighted by the numerous other record flooding events that impacted the U.S. in 2016.
The changing frequency of billion-dollar disaster events
The U.S. has experienced a rising number of events that cause significant amounts of damage. From 1980–2016, the annual average number of billion-dollar events is 5.5 (CPI-adjusted). For the most recent 5 years (2012–2016), the annual average is 10.6 events (CPI-adjusted). The year 2005 was the most costly since 1980 due to the combined impacts of Katrina, Rita, Wilma, and Dennis, as shown in the following time-series. The year 2012 was the second most costly due to the extreme U.S. drought ($30 billion) and Sandy ($65 billion) driving the losses.
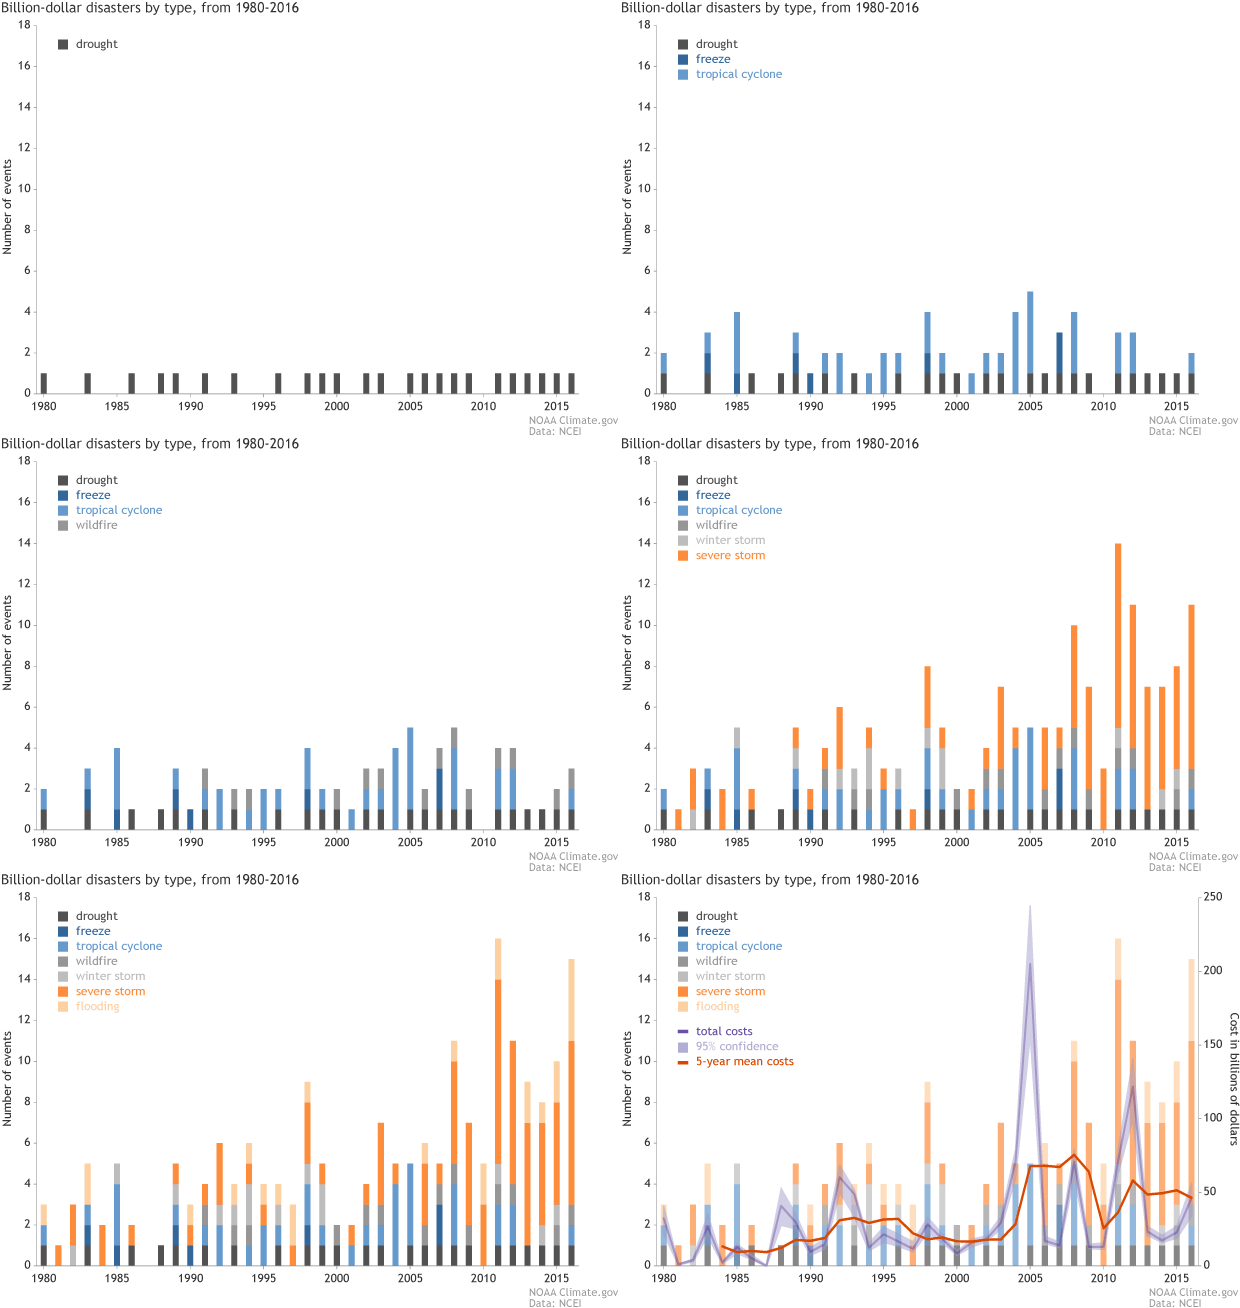
Animation showing the number (bar height) and type (bar color) of billion-dollar weather and climate disasters in the United States since 1980. The purple line shows total annual costs. The red line shows the running 5-year average. NOAA Climate.gov animation adapted from NCEI originals by Adam Smith.
The increase in population and material wealth over the last several decades are an important factor for the increased damage potential. These trends are further complicated by the fact that many population centers and infrastructure exist in vulnerable areas like coasts and river floodplains, while building codes are often insufficient in reducing damage from extreme events. Climate change is probably also paying a role in the increasing frequency of some types of extreme weather that lead to billion-dollar disasters.
Related Content
