Arctic sea ice 2017: Tapping the brakes in September
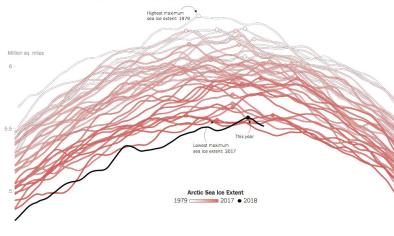
After setting a record low seasonal maximum in early March, Arctic sea ice extent continued to track low through July. However, the rate of ice loss slowed in August and September. The daily minimum extent, reached on September 13, was the eighth lowest on record, while the monthly average extent was seventh lowest. In Antarctica, sea ice extent may have reached its annual winter maximum.
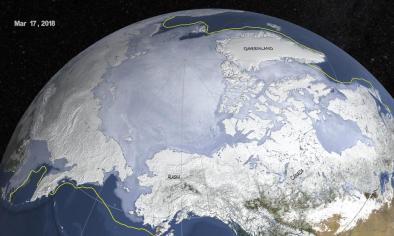
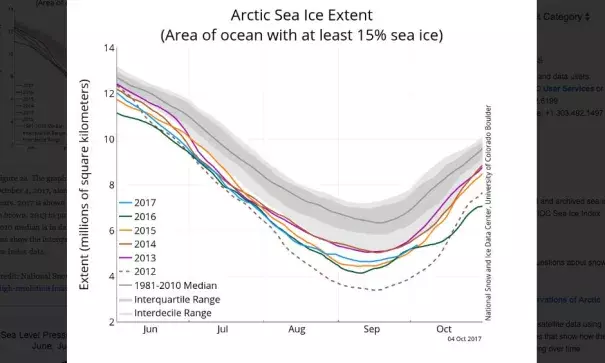
Arctic sea ice extent for September 2017 averaged 4.87 million square kilometers (1.88 million square miles), the seventh lowest in the 1979 to 2017 satellite record. This was 1.67 million square kilometers (645,000 square miles) below the 1981 to 2010 average, and 1.24 million square kilometers (479,000 square miles) above the record low September set in 2012.
...
Conditions in context
September air temperatures at the 925 hPa level (approximately 2,500 feet above sea level) were above average over much of the Arctic Ocean. Temperatures ranged from 5 degrees Celsius (9 degrees Fahrenheit) above the 1981 to 2010 long term average in the far northern Atlantic east of Greenland, to 1 to 2 degrees Celsius (2 to 4 degrees Fahrenheit) above the reference period in the western Arctic.
...
September 2017 compared to previous years
The linear rate of sea ice decline for September is 86,100 square kilometers (33,200 square miles) per year, or 13.2 percent per decade relative to the 1981 to 2010 average. For comparison, the decline rate was calculated at 13.7 percent after the 2013 minimum, and 13.4 percent in 2016. Although sea ice shows significant year-to-year variability, the overall trend of decline remains strong.
Related Content