Atlantic Hurricane Season 2018
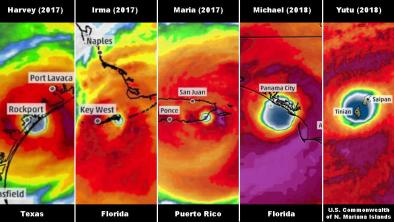
During the 2018 Atlantic hurricane season, Hurricanes Florence and Michael devastated communities in North Carolina and the Florida Panhandle. Due to human interference in the climate system, rainfall during Florence increased by over 50 percent in the heaviest parts of the storm, according to a first of its kind advanced forecast attribution statement about the influence of climate change on a tropical cyclone.[2] Hurricane Michael, meanwhile, was the Florida Panhandle's first landfalling Category 4 hurricane on record and one of the most powerful landfalling U.S. hurricanes ever, after having traveled through seas that were up to 3.6°F (2°C) warmer than the historical average.[3]
Human‐caused climate change is supercharging hurricanes and exacerbating the risk of major damage in three primary ways.[1] Sea level rise elevates and extends the reach of coastal storm surge flooding, which is the main driver of damage in coastal regions. Warmer air temperatures allow storms of all types, including hurricanes, to hold more moisture, which increases the risk of extreme precipitation and flooding. Finally, there is a significant risk that climate change may be driving increases in storm intensity and the rate at which storms intensify, increases which have been documented in several ocean basins, including the Atlantic. These increases are thought to be linked to warming seas that offer more energy to passing storms.


Climate science at a glance
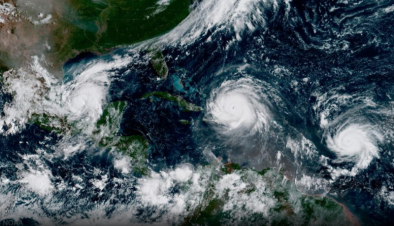
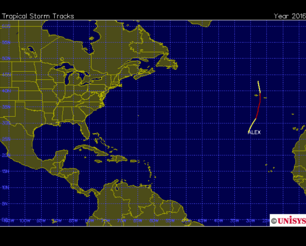
For the fourth consecutive year, tropical storm activity began early in the Atlantic in 2018, with the formation of Tropical Storm Alberto on May 25. In September, Hurricanes Florence, Helene and Isaac made 2018 the second consecutive year in which three Atlantic hurricanes were simultaneously active. As of November 20, the 2018 season witnessed 15 named storms, including 8 hurricanes, above the long-term average of 12 named storms and 6.4 hurricanes observed over 1981–2010. By November 1, the total Accumulated Cyclone Energy (ACE) for the season reached 127 units, already well above the long-term average.
- Human‐caused climate change is supercharging hurricanes and increasing the risk of major damage.[1]
- Sea level rise has significantly extended the reach of storm surge and coastal flooding driven by hurricanes
- Global warming is fueling extreme rainfall, increasing the threat of rain and flooding driven by hurricanes.
- Hurricanes have grown stronger over recent decades. There is a significant risk global warming may be driving that trend.
- Infrastructure built to withstand the storms of the past can collapse as new extremes overwhelm and push infrastructure past design thresholds.
Climate signal breakdown
Climate signal #1: Increased storm surge
The most important impact of tropical cyclones in coastal regions is storm surge.[2] Increases in storm surge related to climate change can be due to rising seas, increasing storm size, and increasing storm wind speeds.[2][3]
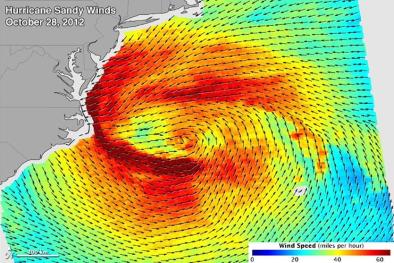
Climate change has already contributed about 8 inches (0.19 meters) to global sea level rise,[4] and this has dramatically amplified the impact of cyclones by increasing baseline elevations for waves and storm surge.[4][5][6][7] A small vertical increase in sea level can translate into a very large increase in horizontal reach by storm surge depending upon local topography. For example, sea level rise extended the reach of Hurricane Sandy by 27 square miles, affecting 83,000 additional individuals living in New Jersey and New York City[5] and adding over $2 billion in storm damage.[7] Aided by sea level rise, Hurricane Matthew set several storm tide records during its approach to the eastern seaboard.
Storm surge in 2018's hurricanes:
- Hurricane Florence:
-
A rapid analysis by the First Street Foundation found that sea level rise was responsible for 11,000 (20%) of the homes impacted by Florence's storm surge.[8] Tidal data shows that relative sea level off the coast of the Carolinas has risen about half a foot since 1970.[8]
-
Major (category 3 and 4) hurricanes in the Carolinas have historically generated storm surges in the 15-20 foot range.[9]
-
In New Bern, North Carolina, 10 feet of storm surge flooded neighborhoods.[10]
-
- Hurricane Michael:
-
On the afternoon of October 10, Apalachicola saw storm surge of 7.72 feet.[11] The city's previous record was 6.43 feet.[11] Sea level there is rising at a rate of 0.73 feet per 100 years.[12]
-
The National Hurricane Center's Storm Surge Unit estimates that an area of the Florida coast extending from Mexico Beach through Apalachee Bay saw peak storm surge inundation values of 9-14 feet.[11] Sea level near Mexico Beach is rising at a rate of 0.75 feet per 100 years.[13]
-
Climate signal #2: Increased extreme precipitation
Climate change is fueling extreme rainfall and dramatically increasing rainfall across many types of storms.[14][15] Estimates of the impact have been calculated for individual hurricanes: a 2007 study covered Katrina and Ivan,[15] two 2017 studies[16][17] and one 2018 study[18] estimated climate change increased Harvey's rainfall by about 15-20 percent; and another 2018 study found that the average rainfall of Hurricanes Katrina, Irma and Maria was 4-9 percent greater due to climate change.[19] An increase in rainfall rates is one of the more confident predictions of the effects of climate change on tropical cyclones.[2]
One of the clearest changes in weather globally is the increasing frequency of heavy rain.[20] Over the past century the US has witnessed a 20 percent increase in the amount of precipitation falling in the heaviest downpours. Over the period from 1994-2008, extreme precipitation events linked to hurricanes accounted for more than 33 percent of the observed increase in heavy events across the US.[21] The Southeast in particular saw a 40 percent increase in the amount of precipitation falling in the heaviest events, and 100 percent of this increase is linked to hurricane events.[21]
The increase in extreme precipitation has increased the threat of flooding, dramatically illustrated by the 1,000-year rainfall dropped by Hurricanes Matthew, Harvey, and Florence. Inland cities near large rivers in the US now experience more flooding, and this shift is consistent with climate change.
As the global average temperature increases, so too does the ability of the atmosphere to hold and dump more water when it rains.[14] Atmospheric water vapor has been increasing.[22][23] And the observed increases have been studied and formally attributed to global warming.[4][24][25]
Storms reach out and gather water vapor over regions that are 10-25 times as large as the precipitation area, thus multiplying the effect of increased atmospheric moisture.[14] As water vapor condenses to form clouds and rain, the conversion releases heat that adds buoyancy to the air and further fuels the storm.[26] This increases the gathering of moisture into storm clouds and further intensifies precipitation.[14]
Over the last three decades, extreme and record-breaking rainfall events have significantly increased globally, and the fingerprint of global warming has been firmly documented in this pattern. Climate change is now responsible for 17 percent of moderate extreme rainfall events, i.e. 1-in-3 year events. The more extreme the event, e.g, 1-in-30 year events, the more likely climate change is responsible, as climate change affects the frequency of the extreme events the most.[27][28]
Extreme precipitation in 2018's hurricanes:
-
-
Unleashed dozens of inches of rain on parts of North Carolina, including 25.87 inches on Hofmann, 30.58 inches on Swansboro, and 35.93 inches of rain on Elizabethtown, according to preliminary rainfall totals. Widespread rainfall was so extreme it was calculated as a "1-in-1,000 year event."
-
Dropped over 50 percent more rain in its heaviest parts than it would have in the absence of climate change, according to a first of its kind advance attribution study.[29]
-
Preliminarily topped North Carolina's tropical cyclone rainfall record of 24.06 inches set during Hurricane Floyd in 1999 in twelve locations.[30]
-
Preliminarily topped South Carolina's tropical cyclone rainfall record of 18.51 inches from Tropical Storm Jerry of 1995 in six locations.[31]
-
-
-
Some of the top rainfall totals from the storm were as follows: 5.26 inches at Sumatra, FL; 5.54 inches in Ozark, AL; 6.48 inches near Powder Springs, GA; 6.01 inches near Hartsville, SC; 9.62 inches near Black Mountain and 6.75 inches near Boone, NC; and 5.75 inches near White Gate, VA.[11]
-
Climate signal #3: Increased sea surface temperatures
Tropical cyclones are fueled by available heat. Warming seas have increased the potential energy available to passing storms, effectively increasing the power ceiling or speed limit for these cyclones.[2][32] In parallel there has been a global increase in the observed intensity of the strongest storms over recent decades.[33][34]
According to the Fourth US National Climate Assessment (2017), "Both theory and numerical modeling simulations (in general) indicate an increase in TC intensity in a warmer world, and the models generally show an increase in the number of very intense TCs," And in looking at recent hurricane trends in the Atlantic, the Assessment further reports that "there is broad agreement that human factors have had an impact on the observed oceanic and atmospheric variability in the North Atlantic, and there is medium confidence that this has contributed to the observed increase in hurricane activity since the 1970s." [20]
There is an extremely wide range of natural variability in tropical cyclone activity, making definitive attribution of recent trends challenging. Hurricanes are powered by the difference between ocean temperature and the temperature at various levels in the atmosphere. It is the difference that matters, not the absolute value of the sea surface temperature. In addition, other factors affected by climate change, such as wind shear and the pattern of regional sea surface temperatures, also play controlling and potentially contradictory roles. The balance of all these factors is not fully known.[35][36]
Nevertheless, the fingerprint of global warming in the intensity of tropical cyclones has been identified in one ocean basin: the Northwest Pacific. In 2015, accumulated cyclone energy (ACE) in the western North Pacific was extreme, and human-caused climate change "largely increas[ed] the odds of the occurrence of this event," according to an assessment study conducted by a large group of scientists led by NOAA and published in the fifth edition of "Explaining Extreme Events from a Climate Perspective" by the Bulletin of the American Meteorological Society.[37]
Virtually every study that has been done, dating to 1987, shows increasing potential intensity in most places as our climate continues to warm; the average trend is about 10 mph for every degree centigrade of tropical sea surface temperature increase, or roughly 20 mph for each doubling of atmospheric CO2 concentration.[38]
- Kerry Emanuel, MIT, member National Academy of Sciences
Warm ocean temperatures and powerful winds in 2018's hurricanes:
- Hurricane Florence:
-
Sea surface temperatures are up to 3.6°F (2°C) hotter than normal along Hurricane Florence's path, allowing for further strengthening, according to the National Hurricane Center.[39]
-
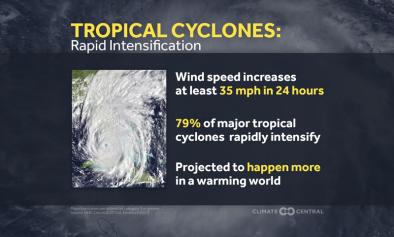
Conditions were so favorable to hurricane development on September 8 that the NHC made their most aggressive rapid intensification forecasts since at least 1998 for an Atlantic storm.[40]
-
- Hurricane Michael:
-
The seas over which Michael traveled before landfall were up to 3.6°F (2°C) warmer than the historical average, a significant increase.[41]
-
North Atlantic trends
As seas warm and offer more heat energy, there has also been an increase in the observed intensity of the strongest storms in the North Atlantic over recent decades. The Third US National Climate Assessment (2014) reports that "the intensity, frequency, and duration of North Atlantic hurricanes, as well as the frequency of the strongest hurricanes, have all increased since the early 1980s."[2][42][43]
Looking back further, a reconstruction of North Atlantic hurricanes dating back to the late 1800s adjusts the historical record in an attempt to account for hurricanes that went unrecorded in the early years, and after adjustment finds that there has been no century-scale trend.[45] However, the U.S. National Climate Assessment reports that "the data are not of a high-enough quality to to determine this with much confidence." Moreover, prior periods of increased hurricane activity due to natural variation do not rule out a role for global warming in the current period of increased activity since the early 1980s. North Atlantic hurricane power is strongly correlated with the temperature of the tropical Atlantic during hurricane season, and both have been increasing over the last several decades.[34]
The close correlation between observed trends in recent sea surface temperatures and observed trends in the intensity of tropical cyclones may reflect a link between warming ocean temperatures and stronger storms.[33][44][45] The increase is well-documented and is consistent with models projecting the future climate, but the correlation between these two trends is not fully understood and may be negated by other factors also driven by climate change. Scientists are still working to better understand the relation between these two trends.[2]
Looking forward, there is a uniform projection by climate models that the frequency of the strongest cyclones will increase. Most models also project that the overall number of cyclones will decline even as the frequency of the most powerful storms increases. And there is some evidence this trend, driven by warming seas, may already be underway.[46]
Unfortunately, these opposing trends do not balance out. The damage caused by hurricanes increases geometrically with wind speed, becoming disproportionately greater as wind speed increases. As a result, under the present climate, almost 93 percent of tropical cyclone damage is caused by the top 10 percent of storms.[47] Moreover, some results point to an increase in frequency across all storms.[2][50] There is a large uncertainty in these projections[2] which represents considerable risk.
We expect to see more high-intensity events, Category 4 and 5 events, that are around 13 percent of total hurricanes but do a disproportionate amount of damage. The theory is robust and there are hints that we are already beginning to see it in nature.
- Kerry Emanuel, professor of atmospheric science, MIT[48]
For the most recent detailed, peer-reviewed consensus synthesis of the science, see the chapter on Extreme Storms in the U.S. National Climate Assessment Volume 1, published late in 2017.
Frequency of landfalling hurricanes
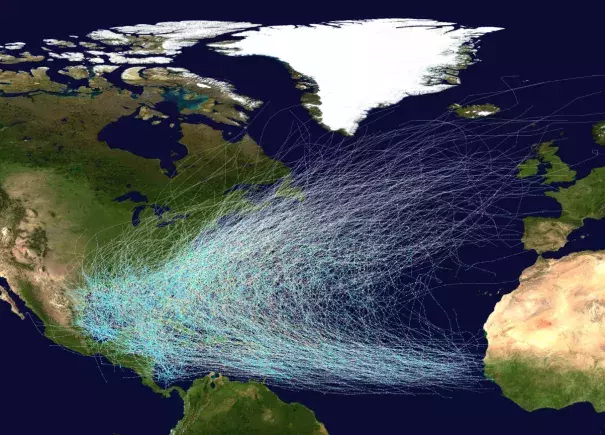
While there is a clear long-term trend in tropical cyclone activity over recent decades in the North Atlantic, the wide range of natural variability in tropical cyclone activity is particularly visible over shorter time periods. This is especially true for hurricanes making landfall in the United States, which are relatively scarce as the large majority of hurricanes in the Atlantic recurve away from the continent and travel eastward as they move north.
A frequency analysis published in the Bulletin of the American Meteorological Society established that the arbitrary choice of metrics is solely responsible for the illusion of a "drought" in landfalling hurricanes in the U.S. prior to 2017.[49] For example, these metrics exclude Hurricane Sandy, the strongest storm on record to make landfall north of Cape Hatteras.
Location and steering
Globally, tropical cyclone activity has migrated poleward (northward in the northern hemisphere) over the last several decades, and this movement as been tentatively linked to the expansion of the tropical zone driven by global warming.[50]
Over the past 30 years, tropical activity (as measured by lifetime-maximum intensity) has not shifted northward for Atlantic Hurricanes.[51][52] However, a recent analysis of Atlantic hurricanes extending back for 450 years reports a clear shift in the track of Cape Verde tropical cyclones north-eastward from the western Caribbean toward the North American east coast, driven since 1870 largely by anthropogenic greenhouse gas and sulfate aerosol emissions.[53] Cape Verde hurricanes form in the low tropics, and are often largest, most intense, and longest-lived storms of the season.
The affect of climate change on the steering of hurricanes is extremely uncertain, and the research reports conflicting indications. Most Atlantic hurricanes recurve eastward away from the coast of the United States. However, recent science on blocking patterns formed by weather patterns driven by climate change indicates there is a possibility of new atmospheric weather conditions emerging that could steer hurricanes towards the eastern seaboard, as witnessed during the travel of Hurricane Sandy through the Atlantic.[54] While the uncertainty is extremely high, this uncertainty translates as new risk.
Hurricanes Harvey and Florence were able to drop more rain on affected locations because they were slow-moving. A 2018 study found that the speed at which tropical cyclones move slowed by 10 percent globally over the six and a half decades between 1949 and 2016.[55] For the North Atlantic specifically, tropical cyclones slowed by 16 percent over that same period.[55] These findings are consistent with atmospheric circulation changes scientists expect to see in an anthropogenically climate-changed world.
Economic damages
Climate models project stronger but possibly fewer or the same number of storms in a warming climate.[36] However the combination of fewer but stronger storms would likely lead to an increase in overall damages. Damage incurred by tropical cyclones is overwhelmingly and disproportionately incurred by the most powerful storms, indicating that overall damage will increase as the climate warms.
Cyclone wind damage increases geometrically with an increase in speed.[56] A decrease in frequency would not be expected to offset the increase in damages incurred by increasing intensity. Moreover, damage escalates exponentially when storm strength crosses over the thresholds beyond which threatened infrastructure collapses.
It's the high end events that are the most destructive historically....More than half the damage that's been done in the United States by storms dating back to the middle of the 19th century has been done essentially by just eight events. So it really is the rare events, the Katrinas, the Sandys, that do the overwhelming amount of damage. Your average run-of-the-mill hurricane will do some damage and be memorable in the local place that if affects, but it doesn't really amount to a hill of beans compared to what the big storms do.[57]
- Kerry Emanuel, Professor of Atmospheric Science, MIT
Other notable tropical cyclones affecting the U.S. and its territories
Most tropical cyclones affecting the U.S. and its territories spin up in the North Atlantic basin, but in 2018, Hurricane Lane and Typhoon Yutu in the Pacific had significant impacts. Individual studies have found the fingerprint of climate change in hurricane activity in the Central Pacific region of Hawaii as well as in the Northwest Pacific, where Typhoon Yutu devastated the U.S. territories of Guam and the Northern Mariana Islands and inflicted heavy damage on the Philippines.
For the first time on record (since 1970), the season total Accumulated Cyclone Energy (ACE) was above average in all Northern Hemisphere tropical cyclone basins (North Atlantic, NW Pacific, NE Pacific and North Indian) in 2018. And ACE was the highest ever on record in the Pacific in 2018.
- Hurricane Lane:
- Dumped a massive amount of rain on Hawaii, even though it never made landfall. With 52.02 inches of rain measured at one gauge on the Big Island, Lane was the second-wettest tropical cyclone ever recorded in the U.S., after Harvey.[58]
- Was only the 6th recorded Category 5 hurricane in this part of the Pacific and the nearest to Hawaii a Category 5 hurricane has ever been observed.[59]
- Was aided by sea surface temperatures along its path on August 19, 2018 that were as much as 4.5°F above the average from 1961 to 1990.[60]
- Typhoon Yutu:
- Made landfall on the island of Tinian in the Northern Mariana Islands as Category 5 super-typhoon with 178 mph winds, making it the strongest storm ever recorded to hit a U.S. territory.
- Was the second-strongest system on record to hit the United States and its unincorporated territories by wind speed.
Related Content