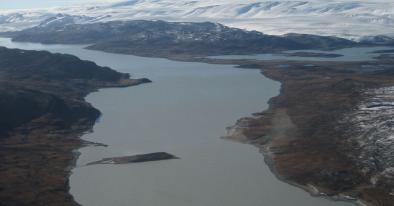
How the Greenland ice sheet fared in 2016

One way to gauge the state of the ice sheet is through what scientists call the “surface mass balance”. This is the difference between how much snow falls and how much ice melts away...
This year’s surface mass balance has come in just below the long term average, which means slightly less ice has accumulated on the surface of the ice sheet than is usual for this time of year...
This year’s “average” outcome belies some quite remarkable weather during the year, including a record early melt event in April followed by a new cold record just three months later in July.
...
A “heatwave” in early April smashed temperature records, which stretch back to the 1880s in some places. This led to the earliest melt event over the ice sheet in records going back to 1980. In this case, we define a melt event as more than 10% of the surface area of the ice sheet undergoing melting during the course of one day (where at least 1mm of water is melted from the surface).
Once the weather recovered to something like “normal”, similar melt events occurred again in early May and late May.
The official beginning of the “ablation” period – the time of year when more ice is lost through melting than is gained by falling snow – occurred at a fairly typical point, in early June. The size of the area of Greenland’s surface that melted was also close to, or just below, average for most of the summer.
Overall, the ice sheet experienced a relatively warm summer, however. Average temperatures in July were 2-4C higher than usual in many places. Interestingly, though, this didn’t include the south, which is typically warmer.
The effect of the extra warmth was evident at low levels in the ablation zone of the ice sheet, which experienced very high melt rates. In fact, on July 19, more than 11 billion tonnes of ice and snow was lost to the oceans in a single day. This is a significant amount of ice, but not quite as high as in 2012 – the year that set the record ice melt in Greenland.
...
Although melt rates stayed relatively high over the summer, especially in the west, the area that experienced melting was relatively small. Melting was suppressed somewhat in June, July and August because of a persistent cap of cold air that sat over the ice sheet.
Contrast this with the record year of 2012, for example, when clear skies and warm moist air moving over the ice sheet assisted the melt season, leading to melting over a very large area.
The same did not happen this year. In fact, the cold air at higher levels was so fixed that temperatures at the summit on 31 July set a new cold record for that month, a chilly -31.1C.
It’s worth noting, however, that the temperature records are short in this region, stretching back only to 1997.
...
Once the rate of calving icebergs and ocean driven melting is factored in, the total mass balance will almost certainly be negative – that is, more ice lost than snowfall gained. Since 2003 the GRACE satellite mission has shown a consistent overall net loss of ice from Greenland each year. Figures covering summer 2016 will likely be available in October or November.
Incidentally, another important factor for interpreting the surface mass balance is that when we talk about the “long term average”, we are referring to the period 1990-2011. This period is already warmer in Greenland than the usual climate normal period of 1961-1990, which means it is likely that what we would call an “average” year now is already rather different to what would have been understood as such 50 years ago.
...
So, what can we learn about Greenland from this year?
Well, that an “average” surface mass balance by the end of the melt season may be hiding some surprising month-to-month variability. This illustrates why it’s important to maintain long term observations to better understand how the Greenland ice sheet is likely to respond to future climate change.
Related Content