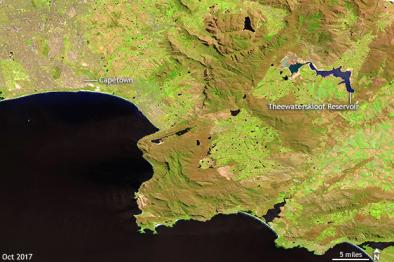
How severe is this drought, really?

Perhaps you have seen “Cape Town rainfall monitor”, aka “The Graph”? If you haven’t, here it goes:

and here go several other ones that are available for locations in the Western Cape:
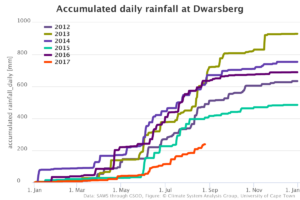
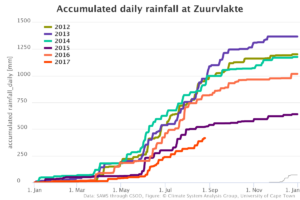
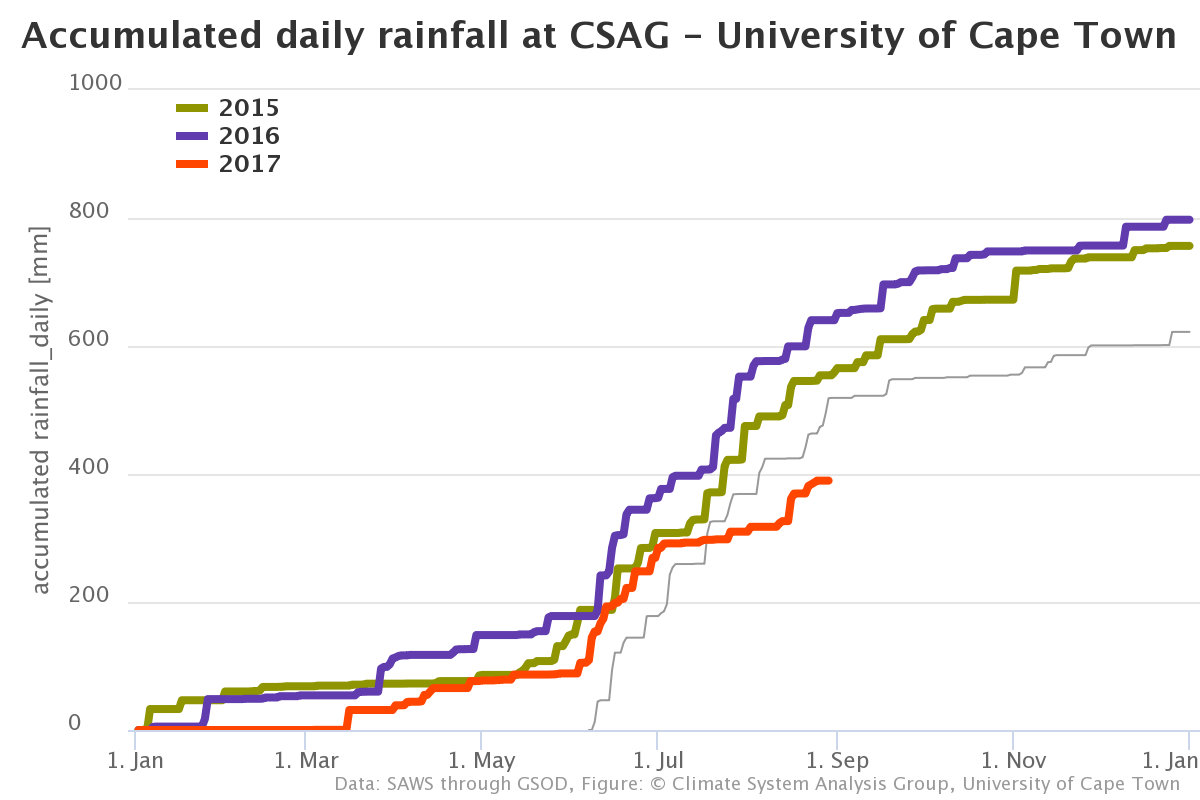
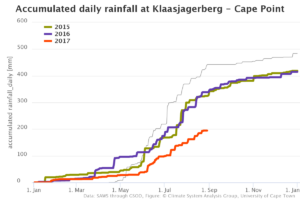
This is where we are now. The total rainfall at the Cape Town airport (CTA) is so far below that experienced in the same part of the year during the last 40 years. The other stations do not have that many years of data available, but they show a similar pattern – this year’s rainfall is substantially lower than the rainfall in the last 4-6 years.
...
[Author conducts analysis, click link below for details.]
These are the resulting return intervals:
2-year (2016-2017) rainfall: 1150 years
3-year (2015-2017) rainfall: 628 years
4-year (2014-2017) rainfall: 63 years
5-year (2013-2017) rainfall: 10 years
The 2 and 3-year events are very, very rare. Calculations on the detrended time series reveal, similarly to those performed on one-year data, that the trend has decreased the return interval, i.e. increased the frequency or in other words the risk of observed events. However, unlike for individual year, that risk has increased by a factor of 3 to 4.
...the above results should make one think hard about anthropogenic climate change as a possible driver of the trend.
Related Content