Headline
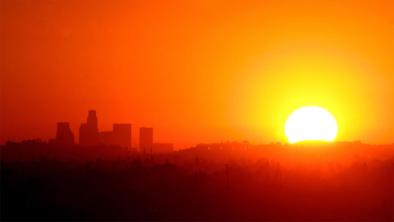
Spring Heads to a Toasty Finish across the U.S.
United States

The ratio of daily record highs to daily record lows across the United States for each decade since the 1920s, expressed as an increment beyond the 1:1 ratio that one would expect in a stationary climate (one not being warmed by added greenhouse gases). The 2000s produced nearly twice as many record highs as record lows, and thus far the 2010s have been even more heat-skewed. Image: Guy Walton
Last week’s national climate roundup for May showed that 2016 for the period January through May was running fourth hottest in U.S. history behind only 2012, 2000, and 2006. Statistics from NOAA on daily record highs and lows back up this picture of a very warm year in the U.S. so far. The period from January through May 2016 saw 11,065 daily record highs and only 1,820 record lows (either tied or broken), according to the Daily Weather Records site maintained by NOAA/NCEI. This ratio of around 6 to 1 is very high for a five-month-long period. The lopsided ratio has continued into June: the first nine days of the month produced a preliminary total of 850 daily record highs and 44 daily record lows, according to NOAA/NCEI
Related Content
Headline
Jan 10, 2017 | Associated Press
US had near record heat, costly weather disasters in 2016
Headline
Jan 4, 2017 | Climate Central
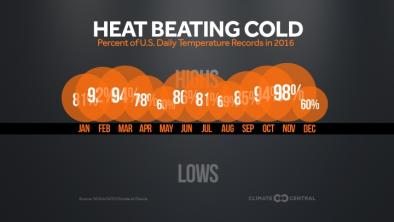
There Were a Crazy Number of Record Highs in 2016
Headline
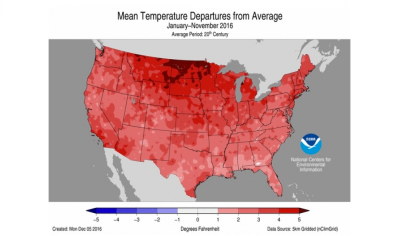
Dec 8, 2016 | Climate Central
Record-Warm Autumn Solidifies 2nd-Hottest Year for US
Headline
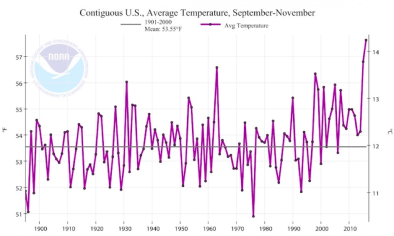
Dec 8, 2016 | Category 6
Autumn 2016: Warmest in U.S. Weather History
