What Does 2017 Look Like in Your Neck of the Woods?
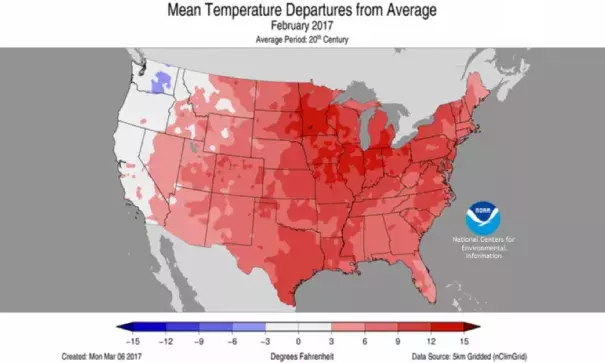
Recently, the National Centers for Environmental Information (NCEI) identified February 2017 as the second-warmest February on record for the contiguous United States (CONUS). According to NCEI’s report, the CONUS average temperature for the month of February was 41.2°F. Compared to the twentieth-century average (1901-2000), the CONUS was 7.3°F warmer than average, indicating February 2017 was an abnormally warm month.
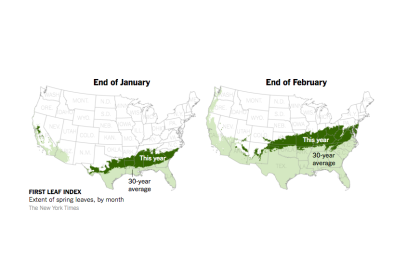
The same can be said for January 2017, with a CONUS average temperature of 33.6°F, which is 3.5°F above average. The warmer than average temperatures so far this year have already led to an early blooming period in the southern and eastern parts of the United States.
...
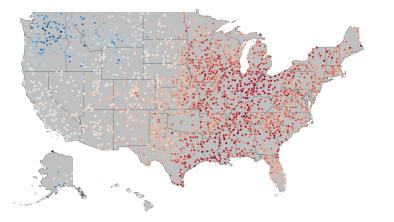
While national reports provide useful information, most people really want to know what the weather was like in their own area, usually from a nearby weather station. Luckily enough, the data used to compile the national reports originate from weather stations in the Global Historical Climatology Network - Daily (GHCN-D) dataset.
Every day, stations around the world report information such as temperature, precipitation, and snowfall. These values are then sent to NCEI for processing, quality control, and archiving for public dissemination. More than 15,000 of these stations are located in the United States, and we can use that data to understand what 2017 looks like so far on the local scale.
Related Content