Map: Observed Change in Very Heavy Precipitation
by National Climate Assessment
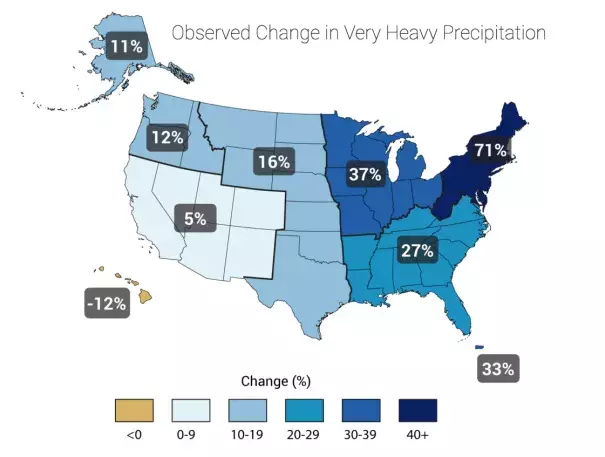
The map shows percent increases in the amount of precipitation falling in very heavy events (defined as the heaviest 1% of all daily events) from 1958 to 2012 for each region of the continental United States. These trends are larger than natural variations for the Northeast, Midwest, Puerto Rico, Southeast, Great Plains, and Alaska. The trends are not larger than natural variations for the Southwest, Hawai‘i, and the Northwest. The changes shown in this figure are calculated from the beginning and end points of the trends for 1958 to 2012.
