2000 Years of Sea Level
by RealClimate
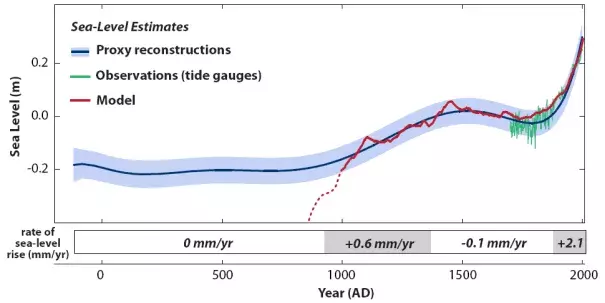
The graph shows how sea level changed over the past 2000 years. There are four phases:
- Stable sea level from 200 BC until 1000 AD
- A 400-year rise by about 6 cm per century up to 1400 AD
- Another stable period from 1400 AD up to the late 19th C
- A rapid rise by about 20 cm since.
The image shows sea level evolution in North Carolina from proxy data (blue curve with uncertainty range). Local land subsidence is already removed. The green curve shows measurements from a nearby tide gauge a reconstruction based on tide gauges from around the world. The red curve shows results from a simple model connecting global temperature with sea level.
For the last millennium the sea level curve follows what can be expected from temperature – the two independent reconstructions thus mutually reinforce each other by their consistency.
