Chart: Sea Level Rise Forecasts for 2100
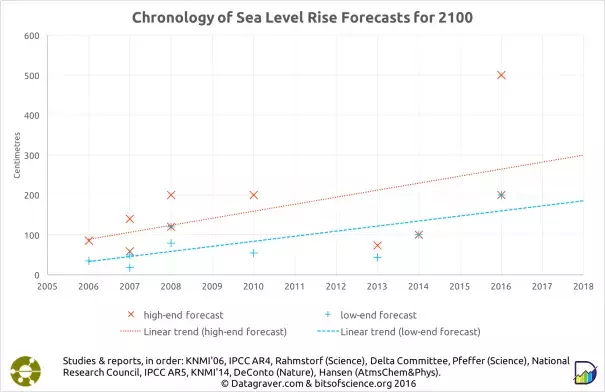
The above scatter plot compares sea level rise forecasts of ten different reports and studies, plotted for the year they were published (between 2006 and 2016). Red values are ‘high end forecasts’ (which correspond to either high emissions/high warming scenarios or to high ice sheet dynamics scenarios), whereas blue values are ‘low end values’ corresponding to opposite scenarios. [Important to note a slight apple/orange element – for instance the fact that one publication (IPCC AR4) uses 2090-2099 as target (instead of 2100), and that different publications use different uncertainty margins (for instance 90% for KNMI’06, 95% for IPCC AR5 & KNMI’14 and ‘high(er) risk’ for Dutch Delta Committee). Also note the difference between metastudies & reports versus individual studies (Science, Nature, Atmospheric Chemistry and Physics).]
Sea level rise forecasts [low end – high end] for 2100, in chronological order: KNMI’06, 2006 (Dutch/NE Atlantic coast): [35 – 85cm]; IPCC AR4, 2007: [18 – 59cm]; Rahmstorf, 2007: [50 – 140cm]; Dutch Delta Committee, 2008: [... – 120cm]; Pfeffer, 2008: [80 – 200cm]; US National Research Council, 2010: [55 – 200cm]; IPCC AR5, 2013: [44 (28-61) – 74 (52-98)cm]; KNMI’14, 2014 (Dutch/NE Atlantic coast): [… – 100 cm]; KNMI update following DeConto, 2016: [… - ±200cm]; Hansen, 2016: [200 – 500cm]. Full references at bottom of article.
