Graph: Cumulative ice mass loss from Antarctica (1992 - 2012)
by IPCC
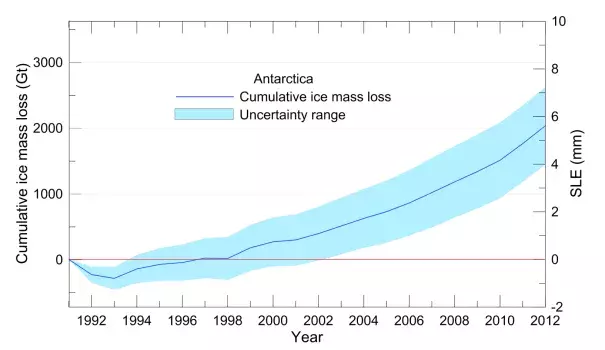
The graph shows the cumulative ice mass loss from the Antarctic ice sheet over the period 1992–2012 derived from recent studies made by 10 different research groups: (Cazenave et al., 2009; Chen et al., 2009; E et al., 2009; Horwath and Dietrich, 2009; Velicogna, 2009; Wu et al., 2010; Rignot et al., 2011c; Shi et al., 2011; King et al., 2012; Tang et al., 2012). These studies do not include earlier estimates from the same researchers when those have been updated by more recent analyses using extended data. They include estimates made from satellite gravimetry, satellite altimetry and the mass balance method.[1]
