Graphs: A threefold rise in widespread extreme rain events over central India
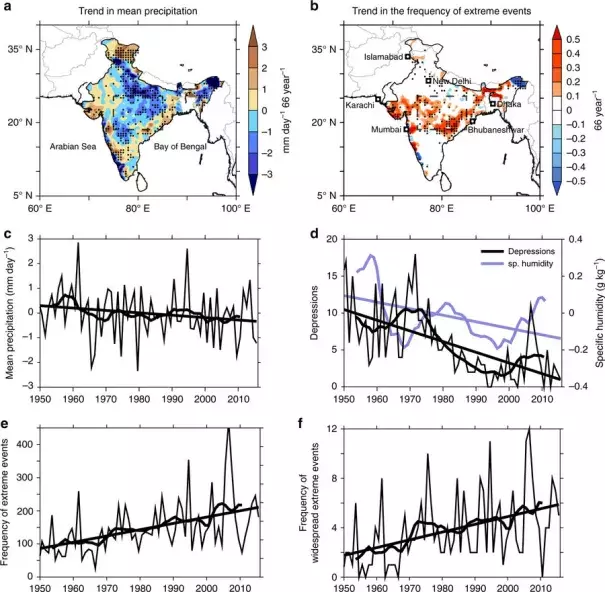
Trends in summer mean and extreme precipitation during 1950–2015. Observed trend in summer a mean precipitation anomalies (mm day−1 66 year−1) and b the frequency (66 year−1) of extreme precipitation events (precipitation ≥ 150 mm day−1). Mean precipitation for the season is 8.1 mm day−1. Time series of c of precipitation (mm day−1), d specific humidity (1000–200 hPa) anomalies (g kg−1), and the number of days with low-pressure systems over central India and e frequency of extreme rain events (number of grid cells exceeding 150 mm day−1 per year) over central Indian subcontinent (75°–85° E, 19°–26° N, inset boxes in a, d). f Time series of the frequency of widespread extreme events (number of days when the extreme events simultaneously cover ten grid cells or more). Stippling indicates trend values significant at 95% confidence level. The trend lines shown in the figures are significant at 95% confidence level. The smoothed curves on the time series analyses represent 10-year moving averages. The entire analysis is for the northern summer (June-September), for the years 1950–2015. The precipitation and cyclone data is based on IMD observations, and the specific humidity is based on NCEP reanalysis.
