Graphs: Tropical cyclones from 1981-2012 grouped by maximum intensity
by International Research Institute
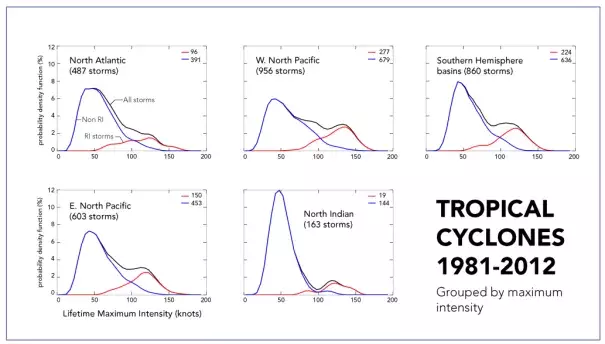
These charts show the distributions of lifetime maximum intensity, in knots, for tropical cyclones in major ocean basins from 1981–2012. Black lines show the distributions for all storms that occurred in a particular basin. Red lines show the distributions for only those storms that underwent rapid intensification, and blue lines for those that did not. It is clear from these plots that tropical cyclones that quickly grew in strength are responsible for extreme storms being more frequent than storms of moderate intensity. This makes tropical cyclones stand in stark contrast to most other kinds of extreme events, for which stronger events are uniformly rarer than weaker ones.
