Infographic: Past and future changes in global mean sea level
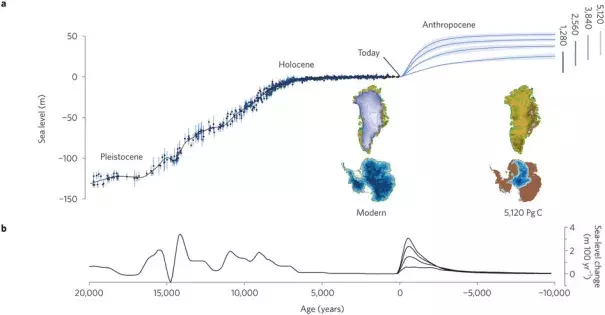
a, Long-term global mean sea-level change for the past 20,000 years (black line) based on palaeo sea level records (black dots with depth uncertainties shown by blue vertical lines)60 and projections for the next 10,000 years for four emission scenarios (1,280, 2,560, 3,840, and 5,120 Pg C). Time series for future projections (mean and one standard deviation) are based on thermosteric contributions from the UVic and Bern3D-LPX models, from modelled land-ice changes driven by UVic model runs with an equilibrium climate sensitivity of 3.5 °C, and from Bern3D-LPX model runs in which the total land-ice contribution was estimated from the relation between the UVic and land-ice model results (see Supplementary Information). Vertical grey bars show range of long-term sea-level rise for each emission scenario derived from a range in equilibrium climate sensitivity (1.5–4.5 °C) from Bern3D-LPX model runs. Images show reconstructions of the Greenland (top) and Antarctic (bottom) ice sheets for today (left) and for the 5,120 Pg C emission scenario (right).
b, The rates of change in global mean sea level (using a 500-year smoothing window).
