Map: New USGS Map Shows Where Hurricane Maria Triggered Landslides on Puerto Rico
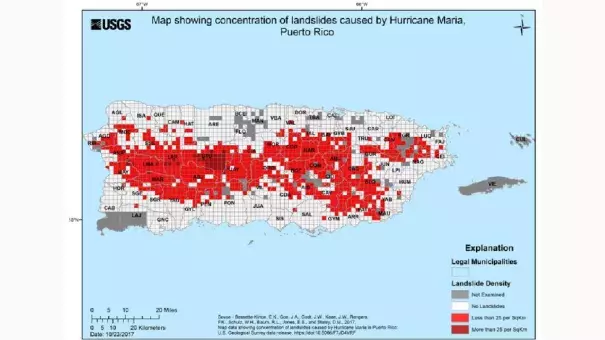
In an attempt to better understand the scope of disaster Hurricane Maria created in Puerto Rico, the U.S. Geological Survey released a new map to show how many landslides occurred on the island last month.
The data, which is preliminary, was plotted on the map above. According to the USGS, it was compiled after an analysis of satellite imagery taken from Sept. 26 through Oct. 8 – the days following Maria's Category 4 landfall on Puerto Rico Sept. 20.
On the map, areas in light red saw between one and 24 landslides per square kilometer, while areas shaded in darker red had at least 25 slides in the same amount of space. Areas in dark gray – some of which are surrounded by areas that reported landslides – were not examined.
When compared to a topographic map of the island, the landslide areas line up almost perfectly with areas of higher elevation. Locations where peaks stretch 2,000 feet or more above sea level are where the most land gave way during the storm's heavy rainfall.
