Map: Temperature trends in southeast Pacific and west coast of South America (1979-2006)
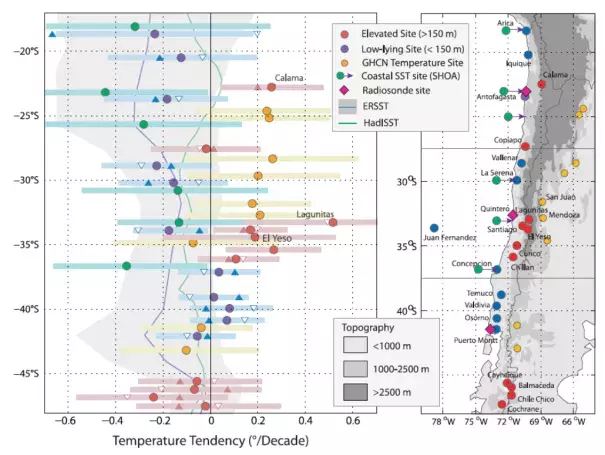
Meridional variation of trends in daily mean temperature for the period 1979–2006.
(a) Circles indicate temperature trends, plotted against station latitude, derived from the data sources indicated in the legend at the top right. Stations in Chile are divided into low-lying (<150 m) and elevated (>150 m) sites. The solid bars represent 90% confidence intervals. Solid upward facing and open downward facing triangles indicate trends in the daily maximum and daily minimum temperature, respectively. The vertical positions of the symbols have in some cases been adjusted slightly so as to clearly separate stations at similar latitudes. The blue and green lines indicate trends from the coastal grid points of two alternative SST analyses (ERSST and HadISST). The solid gray region indicates the 90% confidence for ERSST.
(b) The locations of station data.
