Map: Trend logarithm highest daily precipitation of the year
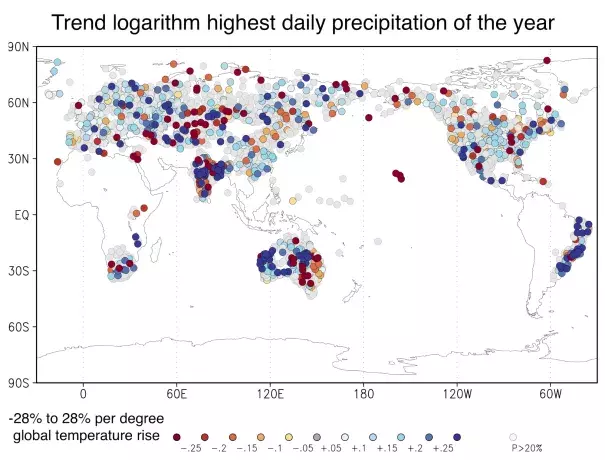
In this analysis, the map shows that the highest daily mean of the year has increased at more stations than it has decreased . . . The average increase is similar to the increase of the amount of water the atmosphere can hold at higher temperatures (the Clausius–Clapeyron relation), about 7% per degree Celsius.
However, there is a large spread around this average. A large part of this is random weather: even in >50-year series, the variability is large compared to the trends. In some areas, there are systematic deviations from Clausius-Clapeyron due to other effects of climate change . . . The trend in Colorado is lower than Clausius-Clapeyron, probably due to higher air pressure during the season of most extremes. Drying trends also suppress extreme precipitation, such as in summer in the Mediterranean region. However, in autumn extremes increase strongly at one mountain range there. Some winter extremes in northwestern Europe are found to increase more strongly than Clausius-Clapeyron due to the increase in zonal circulation types, but others do not.
To conclude, on average daily precipitation extremes increase in intensity, but local trends are often different from the global average.
