Maps: Wet Bulb and Surface Air Global Temperature Trend Assessments
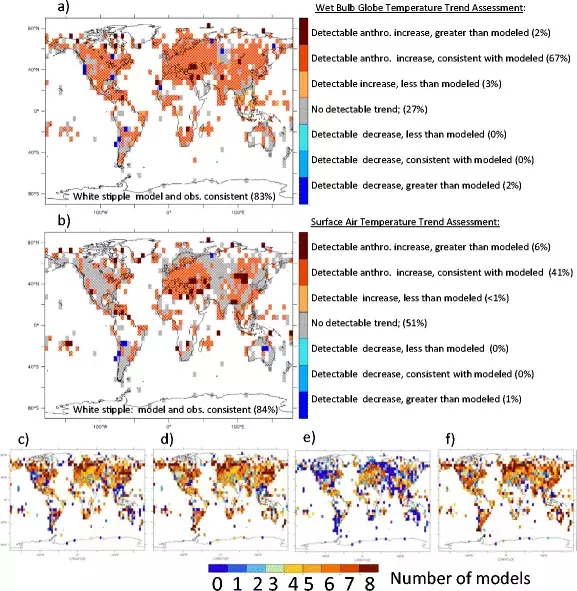
Assessment of summertime trends (1973–2012) in surface: a WBGT and b air temperatures. The assessment compares observed trends with eight-model aggregate distributions of trends from CMIP5 All-Forcing and Natural-Forcing experiments (Fig. 4) (see text). The colors in (a, b) indicate different categories of assessment result; the categories are defined in the legends, along with percent of analyzed area for each category. Grid boxes where the observations and multi-model ensemble of trends are consistent (see text) are white stippled. Panels c and d show the number of CMIP5 models out of eight where: c) the WBGT trend is categorized as a detectable and consistent anthropogenic increase, or d) model All-Forcing runs are consistent with observations. Panels e and f are same as c and d but for surface temperature trends.
