Report: Scorching heat bakes the Southwest in mid-June 2016 | Part II

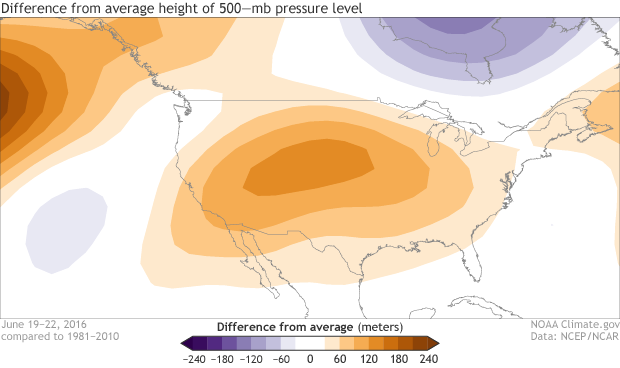
500-mb height anomalies over the United States for June 19-22, 2016. Positive height anomaies (oranges) indicate areas of high pressure while negative height anomalies (purples) indicate lower pressure. During the period, a strong high pressure system was observed over much of the central/western United States. NOAA Climate.gov map, based on NCEP/NCAR Reanalysis data.
...
By some measures, the high pressure system over the Southwest in mid-June 2016 was record-breaking. One marker used to determine the strength of a high pressure is the height in the atmosphere at which a pressure reading of 500 millibars (mb) would be observed. (At sea level, pressure is around 1013mb.) Hot air expands, so the hotter the air mass means the higher up in the atmosphere you would have to go to find the 500mb pressure line. Usually the 500mb level is around 18,000 feet (5500m). On June 19, above Arizona, 500mb was reached at above 19,500 feet (almost 6000m), a daily record.
...
The result was a record-breaking dome of hot air which created dangerous conditions for human health.


