Science Source
Heavy Rainfall Trends in the US
- Reviews heavy rainfall trends for 207 sites across the US from 1949-2013
- References National Climate Assessment chapter on long-term heavy precipitation events for the entire US during the last century, noting observed increase in very heavy precipitation events since the 1950s
- States interest in knowing changes in the rate of heavy precipitation events at smaller geographical scales
- Looks at all airport stations in the US that have a continuous record dating back multiple decades and chooses 1949 as a starting point because 207 geographically distributed stations have complete precipitation records between 1949 and 2013
- Analyzes the frequency of high precipitation events and finds:
- Most of the stations in the US experienced no statistically significant increase or decrease in the number of days with at least 0.05" of precipitation
- Many stations from northern Texas to the Dakotas and then eastward to include the entirely of New England saw a statistically significant increase in the number of days with at least 0.50" of precipitation
- Much of the West consistently recorded a decrease in the number of days with 0.50" of precipitation but only a few stations were statistically significant
- Nearly 90% of stations east of the Rocky Mountains saw an increase in the number of 1.00" precipitation days and approximately half of those stations met the 95% statistical significance threshold
- At the 2.00" threshold, the trend direction (positive or negative) and the significance levels are not nearly as distinct as they were for the 0.50" and 1.00" events; nevertheless, a clear pattern exists in the northeastern portion of the country and a strong majority of stations east of the Rocky Mountains saw an increase in the number of days with at least 2.00" of precipitation
- Though the focus of the analysis was to assess changes in the frequency of heavy precipitation events in small geographical units, it also looks at the results when all stations are averaged together and finds:
- Stations in the southeastern corner of the US have far more days per year with at least 1.00" of precipitation
- The nationwide change in the number of days per year with at least 0.50" consistently increased for most of the 65-year analysis period
- The change in the number of days per year with at least 1.00" was strongly positive
- The change in the number of days per year with at least 2.00" was even more strongly positive; the p-value of 0.001 indicates a very high degree of statistical significance
- Overall, the analysis shows that the rate of small precipitation events has not changed much in the last 64 years; however, when the precipitation intensity rises, so does the strength of the statistical significance
- Finds most of the eastern half of the US has experienced an increase in the number of days with at least 0.50", 1.00", and 2.00" of precipitation
- Finds the western half of the country has, on average, seen a slight decline in the rate of those precipitation thresholds when enough observations are available for analysis– but not at a statistically significant level
- Finds at the station level, the long-term trend of days at different intensity thresholds tells a more complete story than just looking at regional data using state boundaries
- States that while data at an individual station is not sufficient to draw very many conclusions, aggregating station data in this manner allows us to draw new conclusions about how precipitation patterns change over space and time
Related Content
Headline

Oct 24, 2016 | Elmira Star-Gazette
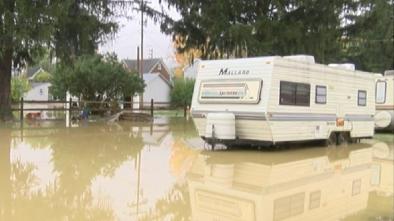
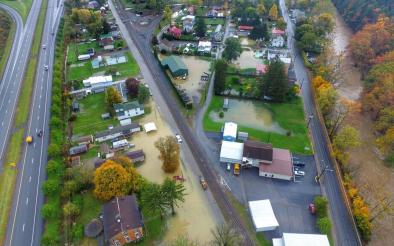
Flooding causes serious damage in Pennsylvania
Headline

Oct 21, 2016 | PA Home Page
Wolf orders National Guard to Lycoming County to assist in flood cleanup
Headline
Oct 21, 2016 | Associated Press
Flooding damages homes as storms sweep Pennsylvania; 1 dead
Headline
Oct 21, 2016 | Centre Daily
‘It’s the fastest I’ve ever seen’ our neighborhood flood
