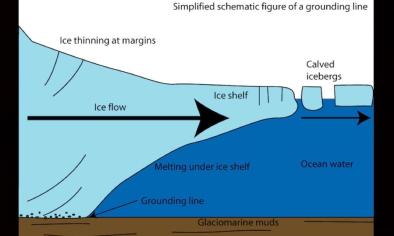
The safety band of Antarctic ice shelves
- States that the floating ice shelves along the seaboard of the Antarctic ice sheet restrain the outflow of upstream grounded ice
- States that removal of these ice shelves, as shown by past ice-shelf recession and break-up, accelerates the outflow, which adds to sea-level rise
- States that a key question in predicting future outflow is to quantify the extent of calving that might precondition other dynamic consequences and lead to loss of ice-shelf restraint
- Delineates frontal areas that we label as ‘passive shelf ice’ and that can be removed without major dynamic implications, with contrasting results across the continent
- Finds that the ice shelves in the Amundsen and Bellingshausen seas have limited or almost no ‘passive’ portion, which implies that further retreat of current ice-shelf fronts will yield important dynamic consequences
- Finds that this region is particularly vulnerable as ice shelves have been thinning at high rates for two decades and as upstream grounded ice rests on a backward sloping bed, a precondition to marine ice-sheet instability
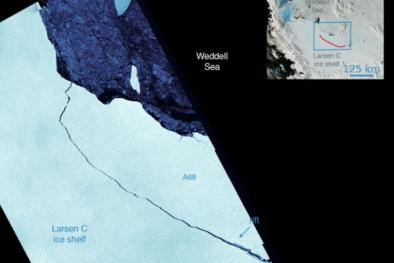
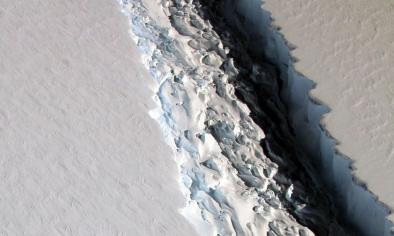
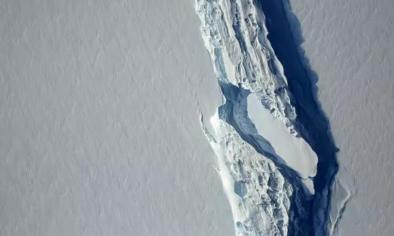
- Finds, in contrast to these ice shelves, Larsen C Ice Shelf, in the Weddell Sea, exhibits a large ‘passive’ frontal area, suggesting that the imminent calving of a vast tabular iceberg will be unlikely to instantly produce much dynamic change
FIGURE 1

The field serves to infer the extent of the PSI area (red contours). For the labelled ice-shelf regions, we computed PSI-area percentages (pie charts and blue numbers). Regional percentage values (bold blue numbers) are given for six sectors (separated by black bars) and for the whole of Antarctica. Maximum buttressing is less informative further upstream, where values exceed 1. There, spatial differences, in how much grounded ice outflow is restrained, are deducible from buttressing quantified in flow direction (Supplementary Section 2.1). Red contours are smoothed (4-km moving average). Black contours delineate floating areas.
FIGURE 2

Low values are found in areas that are generally not well buttressed, and this is where we suspect PSI would be found. For Larsen C, the 0.3 isoline in maximum buttressing is found to delineate the PSI area (red contours). The calving event that is presumably triggered by a rift that continuously opened and propagated in 2014 (ref. 8; black–white dashed line), will mostly remove PSI. Grey shading gives observed surface-velocity magnitudes for grounded ice, with the 100-m yr−1 isoline being highlighted (black dashed lines). Red contours are smoothed as in Fig. 1.
Related Content