Science Source
Sensitivity of Limiting Hurricane Intensity to SST in the Atlantic from Observations and GCMs
- States that a statistical model for the intensity of the strongest hurricanes has been developed and a new methodology introduced for estimating the sensitivity of the strongest hurricanes to changes in sea surface temperature
- Here, the authors use this methodology on observed hurricanes and hurricanes generated from two global climate models (GCMs)
- Finds that hurricanes over the North Atlantic Ocean during the period 1981–2010 show a sensitivity of 7.9 ± 1.19 m s−1 K−1 (standard error; SE) when over seas warmer than 25°C
- Finds, in contrast, that hurricanes over the same region and period generated from the GFDL High Resolution Atmospheric Model (HiRAM) show a significantly lower sensitivity with the highest at 1.8 ± 0.42 m s−1 K−1 (SE)
- Finds similar weaker sensitivity using hurricanes generated from the Florida State University Center for Ocean–Atmospheric Prediction Studies (FSU-COAPS) model with the highest at 2.9 ± 2.64 m s−1 K−1 (SE)
- Finds that a statistical refinement of HiRAM-generated hurricane intensities heightens the sensitivity to a maximum of 6.9 ± 3.33 m s−1 K−1 (SE), but the increase is offset by additional uncertainty associated with the refinement
- Results suggest that the caution that should be exercised when interpreting GCM scenarios of future hurricane intensity stems from the low sensitivity of limiting GCM-generated hurricane intensity to ocean temperature
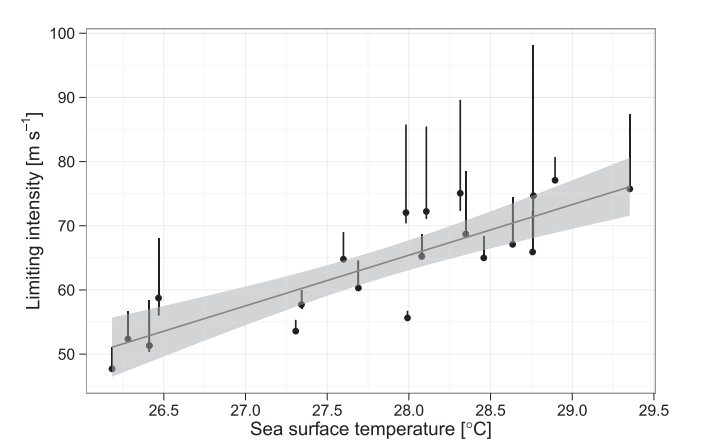
Figure: Limiting hurricane intensity as a function of SST based on the National Hurricane Center (NHC) best track. The line is a weighted regression where the weights are proportional to the number of hurricanes in each grid. The slope of the line is 7.9 m s21K21 and represents the sensitivity of LI to SST. The 95% confidence band about this slope is shown in gray. The 80% uncertainty about the per grid LI estimates is shown by the vertical lines.
Related Content
Science Source
| Geophysical Research Letters
Increasing Magnitude of Hurricane Rapid Intensification in the Central and Eastern Tropical Atlantic
Karthik Balaguru, Gregory R. Foltz, L. Ruby Leung
Headline

Apr 19, 2018 | Miami Herald
NASA team finds massive Everglades mangrove damage from Irma. Can it recover?
Headline

Mar 22, 2018 | Reuters
Last three years hottest on record, severe weather hits 2018: U.N.
Headline
Jan 23, 2018 | Nature
Atlantic hurricanes' rapid growth spurts are intensifying
