US Daily Flood and High Flow Conditions
United States Geological Survey
 Click the link below to select a state from the map to access real-time data. Current data typically are recorded at 15- to 60-minute intervals, stored onsite, and then transmitted to USGS offices every 1 to 4 hours, depending on the data relay technique used. For additional resources, visit the USGS floods page here.
Related Content
Science Source
| Aon Benfield Analytics
2016 Annual Global Climate and Catastrophe Report
Headline
Jan 10, 2017 | NOAA Climate.gov
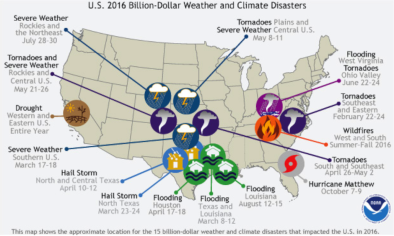
2016: A historic year for billion-dollar weather and climate disasters in U.S.
Science Source
| Geophysical Research Letters
Recent trends in U.S. flood risk
Slater, Louise J., Villarini et al
Real Time Data
Oct 13, 2016 | NOAA
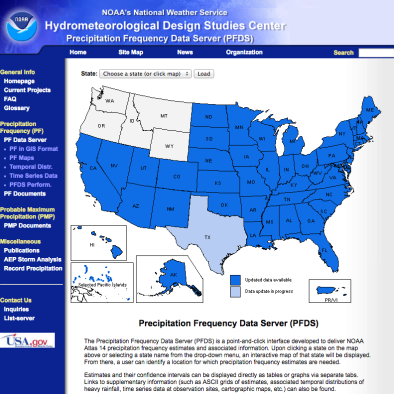
US Precipitation Frequency Data Server
