Headline
El Niño as You've Never Seen it Before
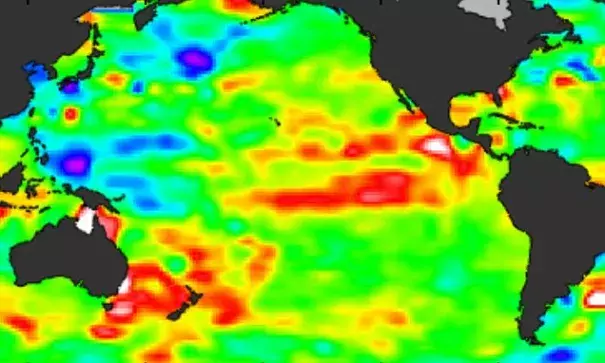
These maps show sea level anomalies from February 12-22, 2016. The Jason-3 satellite has produced its first map of sea surface height, which corresponds well to data from its predecessor, Jason-2. Higher-than-normal sea levels are red; lower-than-normal sea levels are blue. El Nino is visible as the red blob in the eastern equatorial Pacific. Image: NASA
The first complete map of the world's sea surface height has revealed the 2015-16 El Niño in unprecedented detail. The map was created using data from Jason-3, a new US-European oceanography satellite mission launched with the help of Nasa. It shows the first 10 days of data collected once Jason-3 reached its orbit of 830 miles (1,336km) last month, revealing the state of the ongoing El Niño event that began early last year.
Related Content
Headline

Sep 23, 2016 | Los Angeles Times
Why did El Niño miss SoCal? It's complicated, National Weather Service says
Headline
Aug 10, 2016 | California Weather Blog
California drought update; April showers in NorCal; and La Niña Looms
Headline
Aug 10, 2016 | Weather Underground
El Niño is Officially Over—and La Niña is Likely On the Way
Headline
Aug 10, 2016 | Phys.org
Sierra Nevada snowpack not likely to recover from drought until 2019
