Analysis: Peru's Deadly Rainfall Examined With NASA's GPM Data
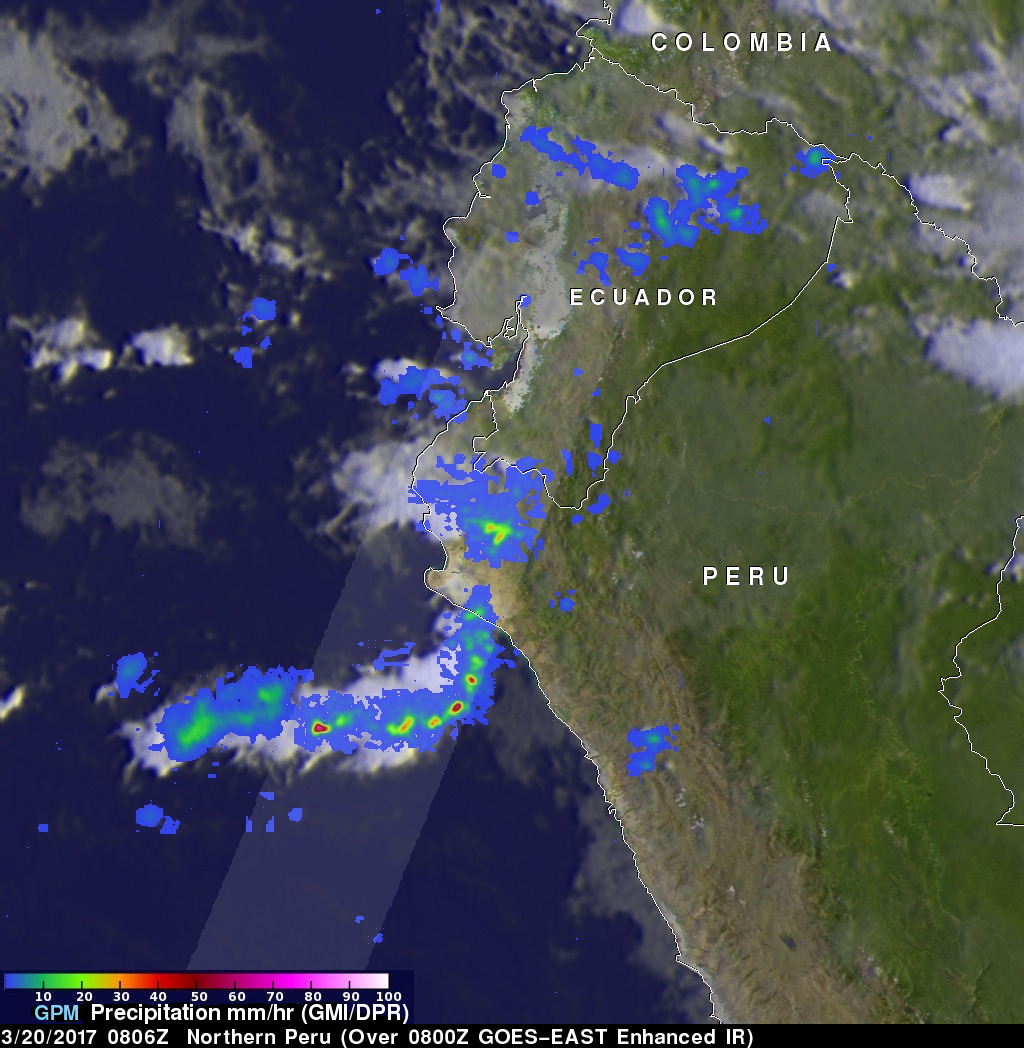
This image shows the locations of storms that were dropping heavy rainfall over northwestern Peru when the GPM core observatory satellite flew above on March 20, 2017 at 0826 UTC. Data collected by GPM's Microwave Imager (GMI) and Dual-Frequency Precipitation Radar (DPR) instruments during this pass revealed that very heavy precipitation was falling in that area. GPM's radar (DPR Ku Band) data indicated that some storms were dropping rain at the extreme rate of greater than 137 mm (5.4 inches) per hour. These extreme rainfall rates were found in the line of storms extending southwestward from Peru's coast.
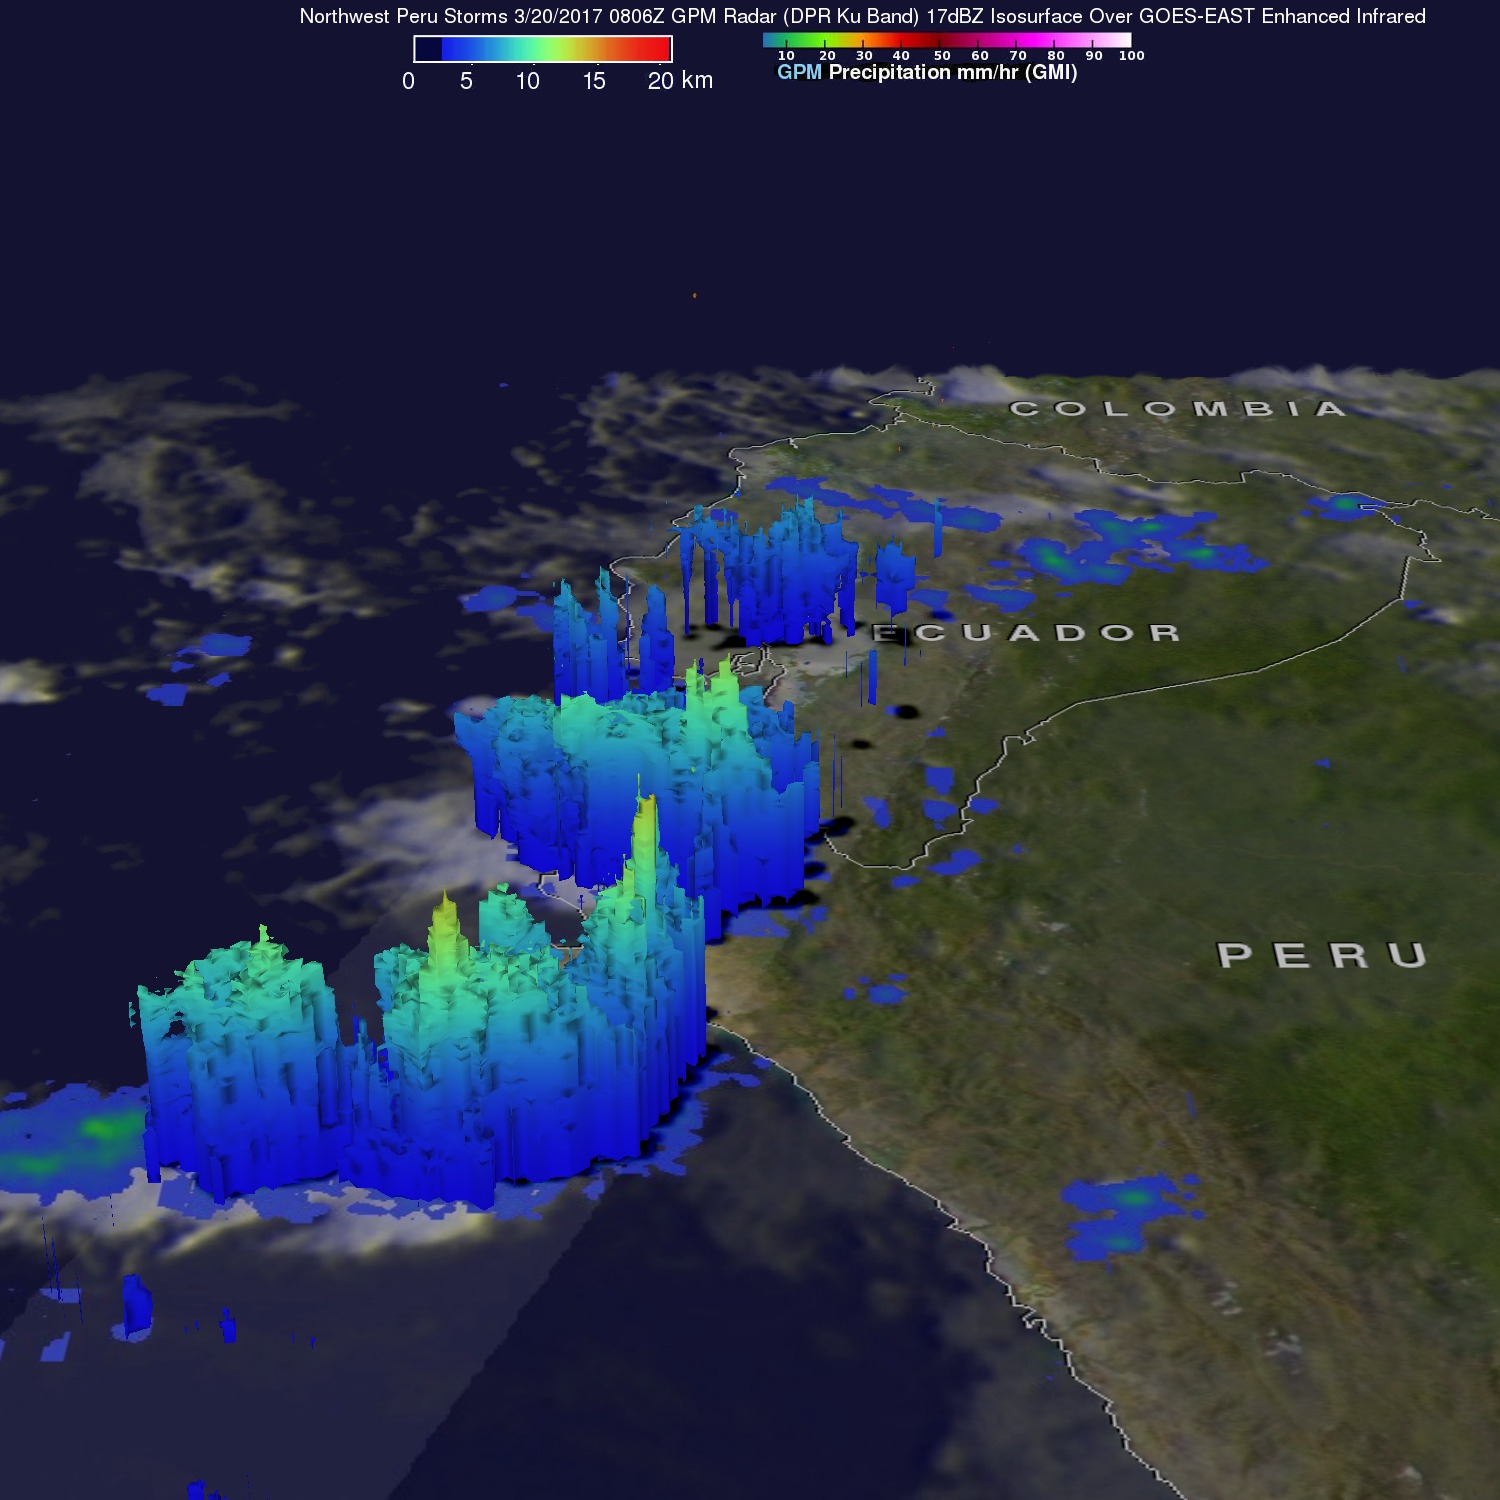
The GPM satellite's Radar (DPR Ku Band) were also used to examine the 3-D structure of precipitation within the storms near and over northwestern Peru. GPM's examination showed that several storms located in the Pacific had tops that were reaching altitudes above 13 km (8.1 miles).

Integrated Multi-satellitE Retrievals for GPM (IMERG) data were used to show rainfall in areas that were not covered by the GPM core observatory satelliteswath. Those estimates are the result of unifying precipitation measurements from a constellation of research and operational satellites. Rainfall estimates are generated by NASA's Precipitation Processing System every half hour. The times shown are the end times of data collection rounded to the nearest minute. This animation shows real-time IMERG rainfall estimates based on data collected during the period from March 14-21, 2017.

