Time Series: Average Global Sea Surface Temperature, 1880–2015
by US EPA
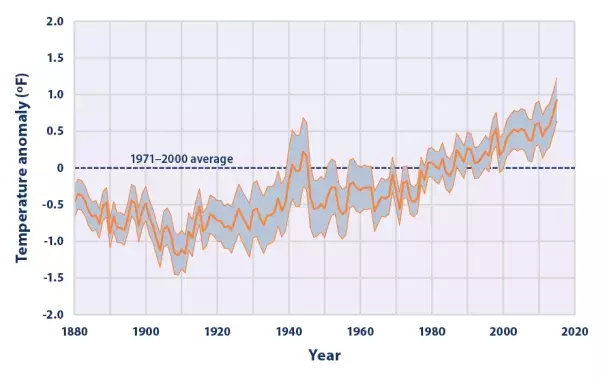
This graph shows how the average surface temperature of the world’s oceans has changed since 1880 and uses the 1971 to 2000 average as a baseline for depicting change. Choosing a different baseline period would not change the shape of the data over time. The shaded band shows the range of uncertainty in the data, based on the number of measurements collected and the precision of the methods used.
Key Points
- Sea surface temperature increased during the 20th century and continues to rise. From 1901 through 2015, temperature rose at an average rate of 0.13°F per decade.
- Sea surface temperature has been consistently higher during the past three decades than at any other time since reliable observations began in 1880.
- Based on the historical record, increases in sea surface temperature have largely occurred over two key periods: between 1910 and 1940, and from about 1970 to the present. Sea surface temperature appears to have cooled between 1880 and 1910.
Data source: NOAA, 2016
Web update: August 2016
