California Nevada DEWS March 2018 Drought & Climate Outlook Webinar
by NOAA
Takeaways
- Definitions: warm snow drought occurs when precipitation is above average and snowpack (SWE) is below average; dry snow drought occurs when precipitation and snowpack are below average
- In mid-November there was a major precipitation event in CA resulting in “warm snow drought” conditions for low and middle elevation regions. Beginning around the first of the year, however, warm snow drought conditions evolved into dry snow drought conditions in all regions due to below average precipitation during January and February.
- Three major storms in March made a large dent in the snow deficit and the magnitude of snow drought conditions, but many regions still have below average precipitation totals
- Looking at 35 years of data for Donner Summit, 2018 was the “5th best March” in terms of positive change in total water year precipitation
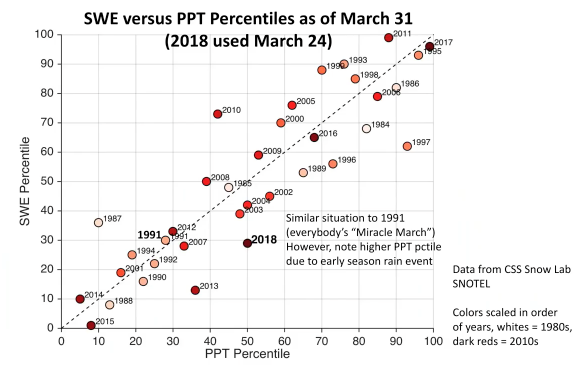
- There’s a cool chart at the end of this email showing precipitation percentile versus snow water equivalent percentile (I believe it’s also Donner Summit data). As of March 24, 2018 is in the 50th percentile in terms of precipitation and the 30th percentile in terms of snow water equivalent. Ben Hatchett attributes the difference to the mid-November event when precipitation fell as rain instead of snow in certain low and mid elevation regions.
Amanda Sheffield
- Some areas reached their record driest in February compared to normal
- Some areas saw above normal precipitation for the month of March
- Central Sierra area is improved by March precipitation
- The last true miracle March
- Scientists are comparing March 2018 to what was the last true Miracle March, 1990-1991 (red line on the figure); graph looks at the Sierra Nevada total storage from SNOWBOT, it looks at the day of the year. When you compare this year (the blue line) we’re still below normal and not getting up to the levels seen in 1990-1991.
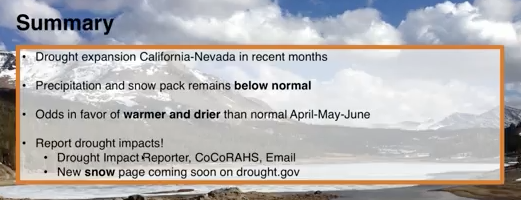
- Looking forward: right now, we are likely transitioning from La Niña to Neutral in the second half of the year
Ben Hatchett
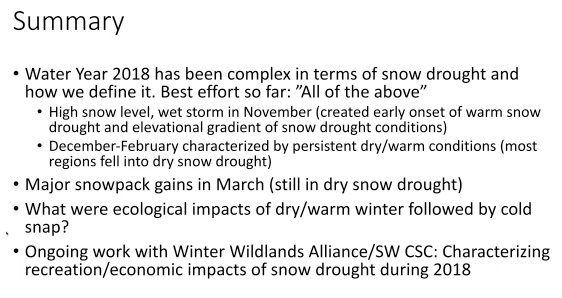
- We’ve seen all of the above in terms of snow drought with respect to impacts and some of the causes from it
- Essentially we’re falling into a deep snow drought which was creating challenges for a lot of sectors of the economy and ecosystems
- Defining snow drought: any time that we have below average snow water equivalent at a given point/place in the mountains for a given point in time
- Two types: dry snow drought (below average snowpack AND below average precipitation, classic drought); warm snow drought (above average precipitation BUT below average snow water equivalent)
- The graph on the upper right hand side shows the 2 snow drought regimes, in both cases we want to be below the 100% median snow water equivalent line, so that’s basically below that 100% line that cuts across, and depending on our % of normal precipitation, that defines whether we’re in a dry snow drought such as 1977 or 2015 (blue and brown dots), or whether we’re in the warm type snow drought (which many of the other years on the graphic show, where we had above average precipitation but below average snowpack)
- Something else that is particularly of interest, elevation very much matters as well, and we can see that particularly in the warm type snow droughts where the scatter of the dots for certain years spans snow drought conditions but also perhaps above average snowpack conditions, so like the years of 1970 on the bottom left side and 1997 on the bottom right side where at the highest elevations we had above average precipitation and above average snowpack, where at lower elevations we had below average snowpack
- 2018: the early season (Oct-Nov) we were doing okay by the end of November; then moving into winter, very dry December and January; well below average throughout the region due to the anomalous blocking high pressure ridge diverted all the storms to the north into Washington, BC, Montana, and more of the northern intermountain west; as a result of that, by the end of February we were deep into below average snowpack conditions from the southern Sierra all the way into the southern Cascades and throughout much of Nevada; things dramatically improved during March, we had three really good storm events come through, two of which were notable atmospheric rivers; that produced substantial precipitation throughout the central coast of CA, and throughout much of the Sierra Nevada and into the northwestern and northeastern parts of the Great Basin and Nevada; precipitation is still a little bit below average in the southeastern portion of Nevada into the southern regions of CA and AZ; those anomalous precipitation events led to a substantial improvement in our snowpack; still below average in many regions, but we did make a very large dent in the snow deficit and the magnitude of snow drought conditions; as a result of the colder storms that we’ve been having, there were anomalous positive differences in snow water equivalent for some of the lower elevations, particularly in the western slope of the Sierra Nevada and some of the regions in the southern Cascades
Looking at different elevations:
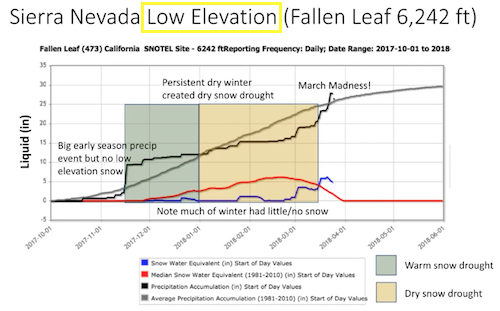
- LOW ELEVATION
- Early season, mid-November event produced quite substantial precipitation; however, high snow levels during that storm resulted in no snow accumulation at the lower elevations; so you can see that snowpack for the year (the blue line) was at or well below normal throughout much of the early part of the winter because we did not accumulate any precipitation during that first event, so lower elevations were in warm snow drought (above average precipitation but below normal snow pack)
- This was followed a persistent dry spell which then drove us into dry snow drought conditions, starting right about the turn of the year where we had below average snowpack and, note that there was almost no snow, or there was no snow at low elevations for much of the winter season, and below average precipitation; that was to some extent remedied a bit by our March Madness, or Miracle March, where we see a substantial increase in precipitation accumulation during the last three weeks and we did accumulate some late season snowpack, so at this point, if you were to look at Fallen Leaf Lake you’ll see we are well above normal interns of snowpack and precipitation
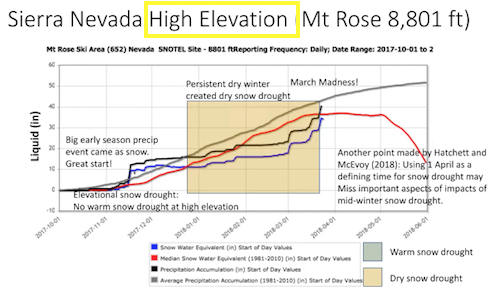
- HIGH ELEVATION
- Moving to a higher elevation location, now we’ll look at Mt Rose Summit to the northeast of Lake Tahoe, we see our big early season precipitation event; much of this came as snow, which set us off on a good start to the year where we were above average precipitation and snowpack wise, however our persistent drought conditions eventually led us into a dry snow drought onset, where we fell into below normal precipitation and below normal snow pack which lasted throughout much of the winter; currently we are just barely in dry snow drought conditions, though we’re close to normal
- If we use a singular point in time definition of snow drought, say April 1, you may totally miss the fact that much of the season was in snow drought and that may come with impacts that could potentially be ignored; it’s important to look at the whole year in context to see how snow drought conditions evolved in time
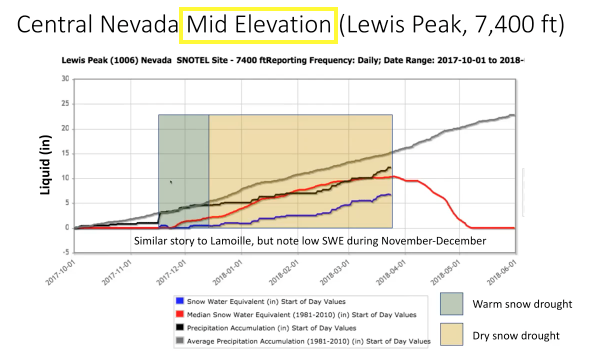
- MID ELEVATION
- In the Central Nevada, the story was similar but a little different; we again had a warm snow drought to start which transitioned into a dry snow drought; but at the lower elevation there was little to no snow pack accumulated and existed throughout much of the early part of winter which may have interesting impacts on rangelands and mid elevation regions of the Great Basin; actively exploring how these low snow conditions during much of the peak meteorological winter may have impacted the Great Basin systems
- About the Miracle March:
- Looking at Donner Summit from the Central Sierra Snow Lab SNOTEL where we have 35 years or so of data, 2018 was the “5th best March” in terms of positive change in total water year precipitation; “it was a good March”
- Looking at change in snow water equivalent over the month, March 2018 made up substantial ground
- SWE: the amount of liquid water stored in the snowpack
- Looking at SWE versus precipitation percentiles for the month (chart below), we can see that 2018 is not nearly as bad as it was if you had picked many of the other points in time for the month, when we would have much further down and to the lefthand side; now we’re close to average precipitation, right near the 50th percentile precipitation-wise; we’re still in the bottom tercile of snow water equivalent for the year, very similar to 1991 for the point of time; but of note is how much wetter this year has been compared to 1991 and that’s primarily due to that initial, very wet storm in mid-November that drove us further over to the righthand side; (the snow lab is located at about 7,000 feet where much of that first storm came as rain, so we did not get that snow pack accumulation; had that initial storm came as snow, we probably would have been pushed further up closer to that 1:1 dashed line and would have been about average for this point in the year)