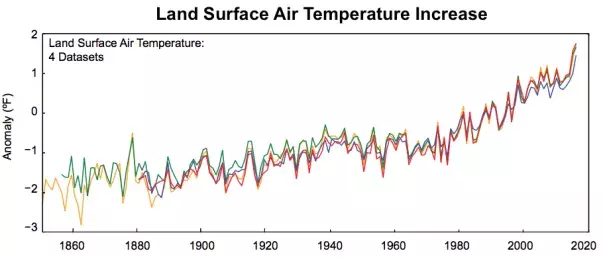
Chart: Land Surface Air Temperature Increase by NCA 4, NOAA NCEI and CICS-NC The chart above shows land surface air temperature using 4 datasets.1850–2016 temperatures are shown relative to the increase observed from 1976–2005. Go to Site