Chart: Temperatures in the Contiguous 48 States, 1901-2014
by Environmental Protection Agency, NOAA
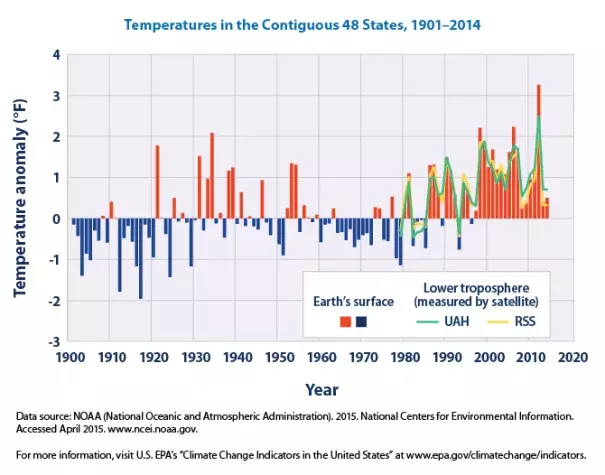
This figure shows how annual average temperatures in the contiguous 48 states have changed since 1901. Surface data come from land-based weather stations. Satellite measurements cover the lower troposphere, which is the lowest level of the Earth’s atmosphere. “UAH” and “RSS” represent two different methods of analyzing the original satellite measurements. This graph uses the 1901–2000 average as a baseline for depicting change. Choosing a different baseline period would not change the shape of the data over time.
