Charts: Heavy Precipitation in the Midwest, A City View
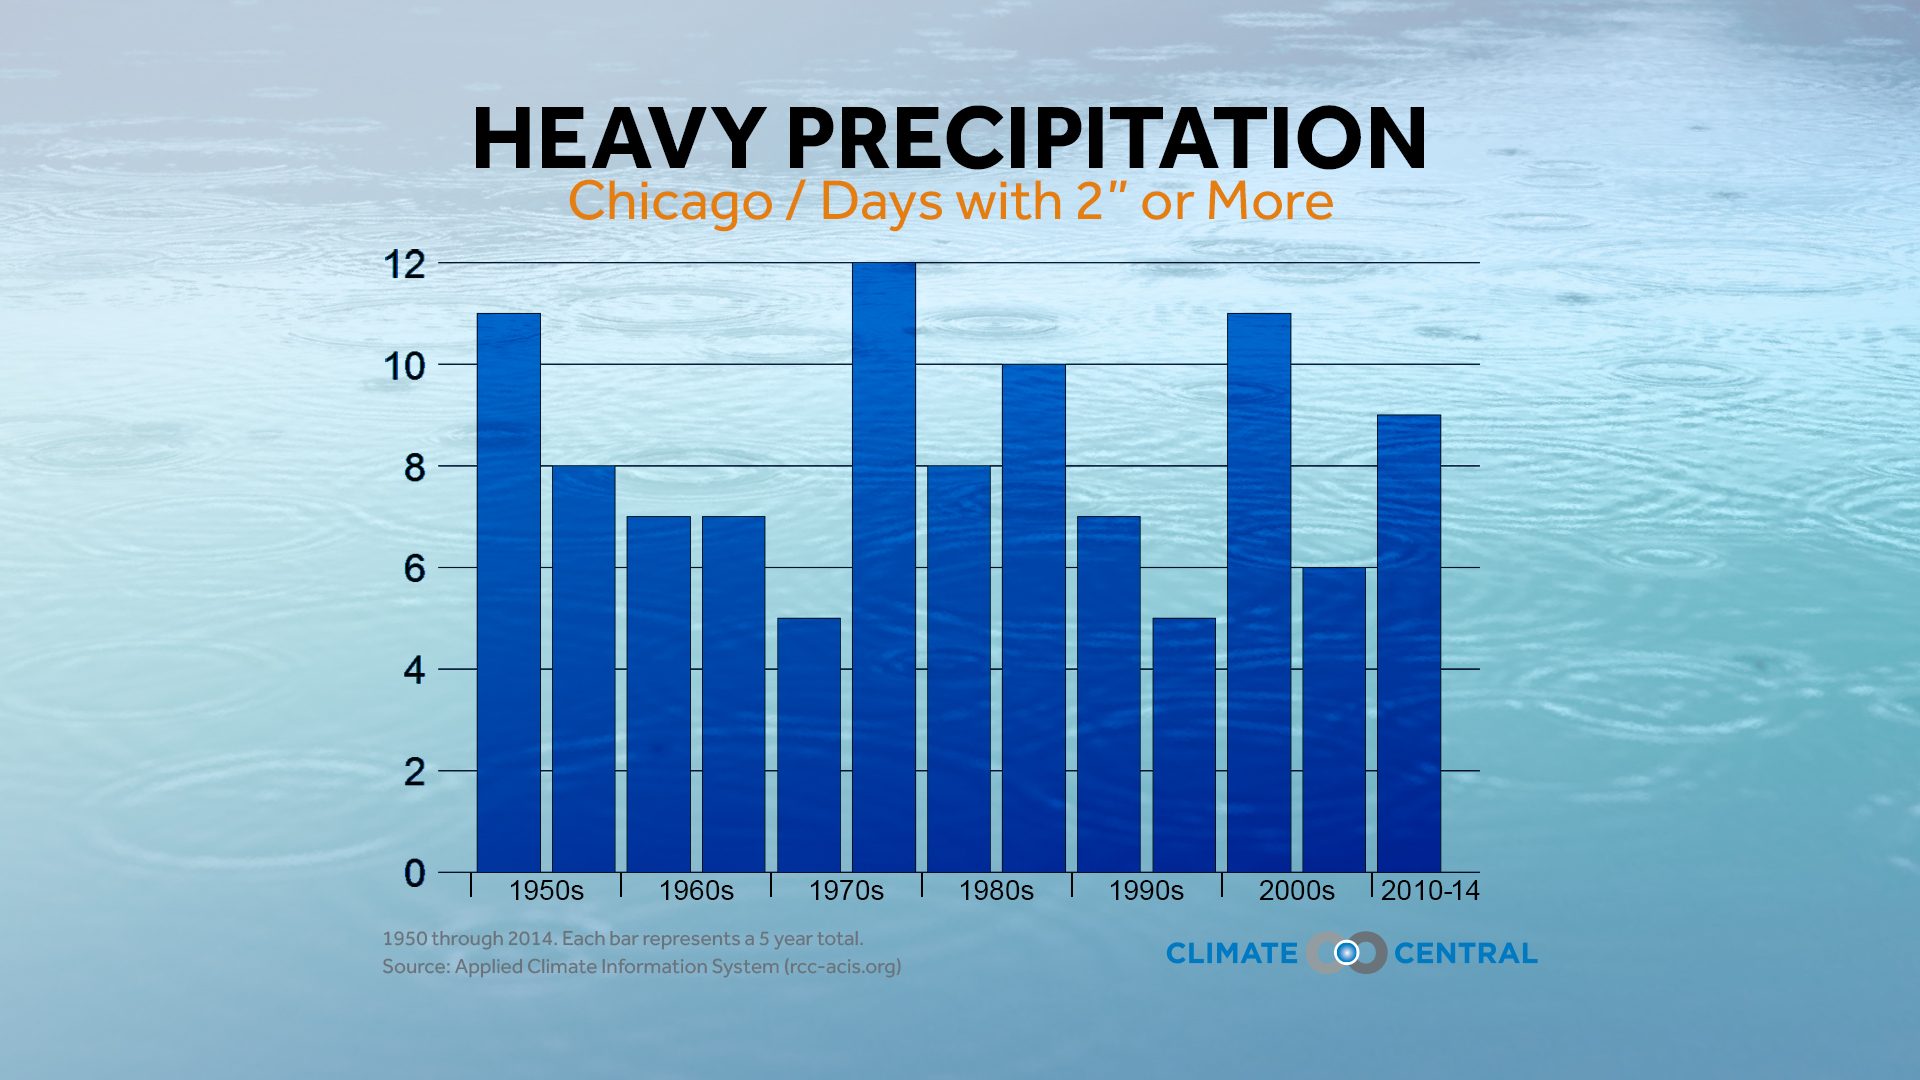
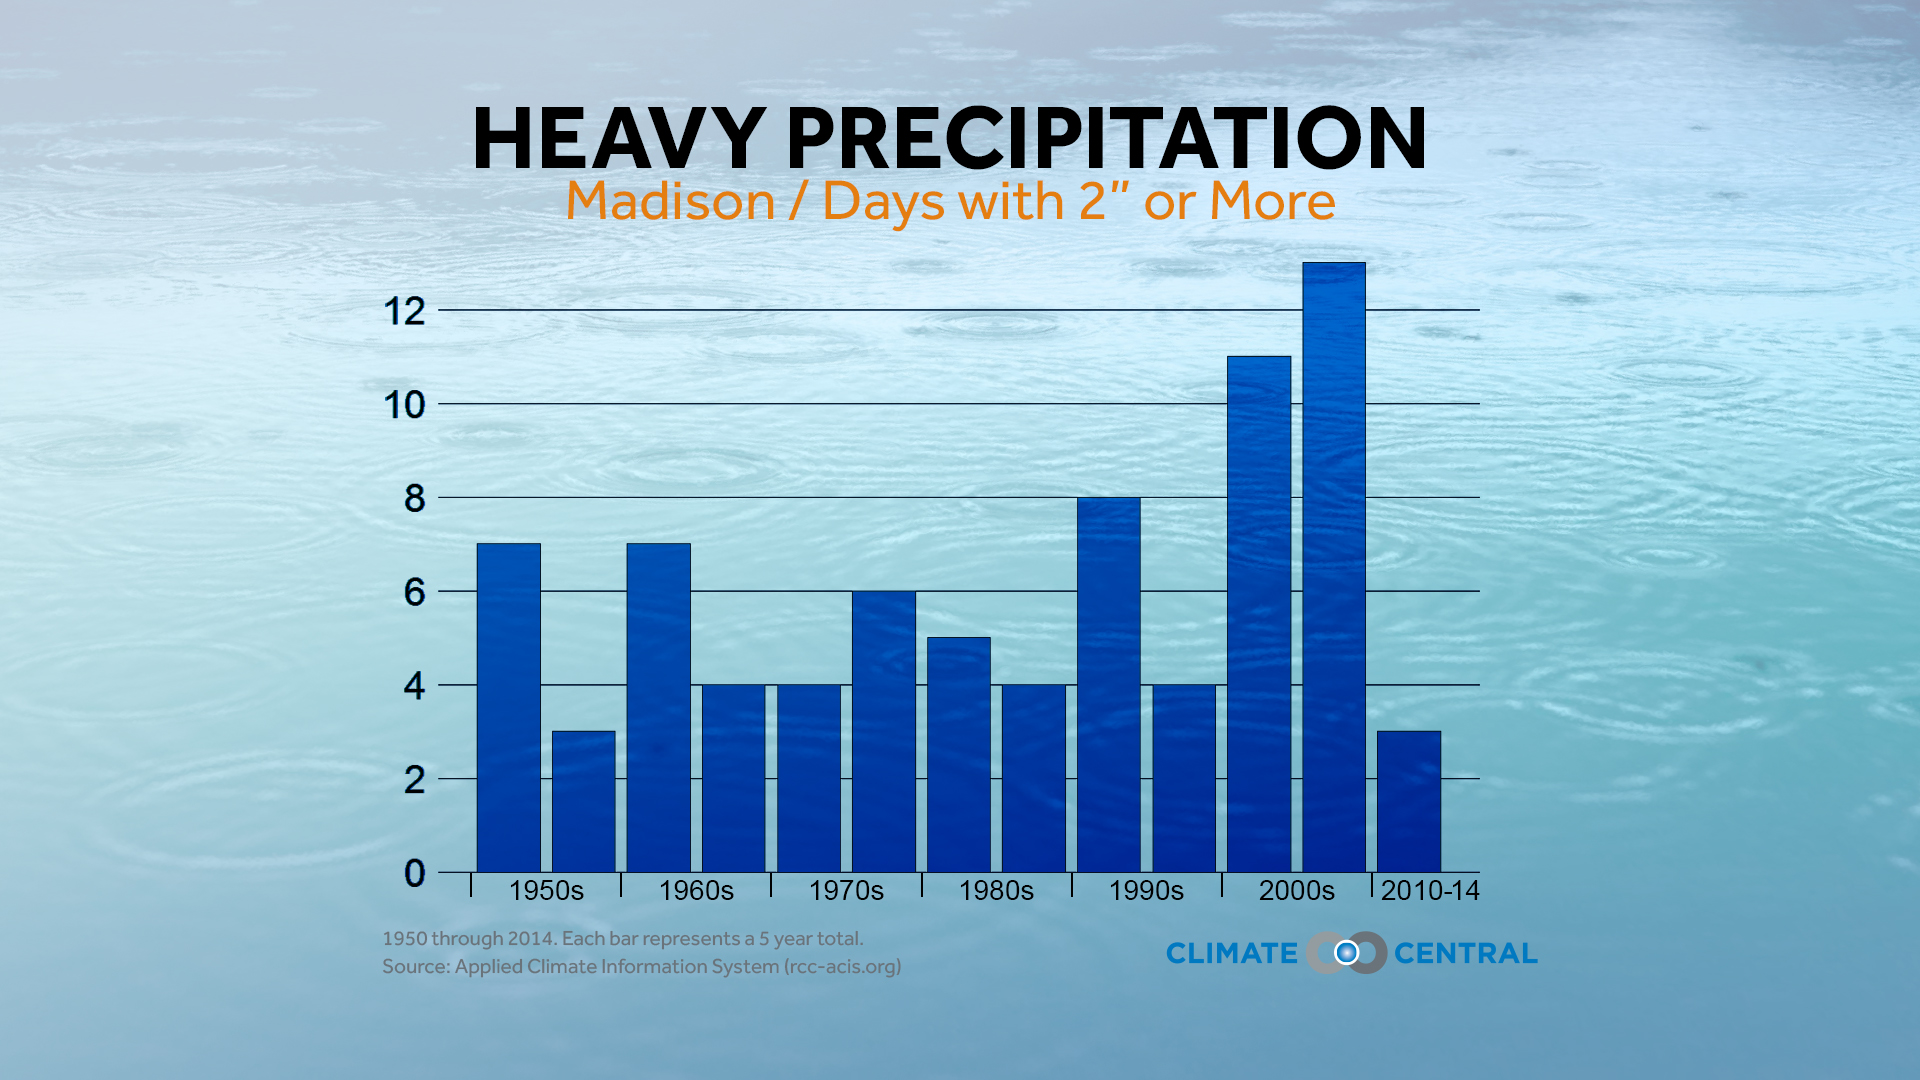
Climate Central looked at rainfalls (or rainfall equivalents) of 1”+, 2”+, and 3”+ in a single calendar day since 1950. We used three different standards because a 1”+ rainfall in Miami, for example, isn’t all that extreme while the same amount in Las Vegas is highly unusual.
In the national graphic (first below), the data come from 207 airports across the continental U.S. where records have been reliable and continuous since at least 1950. And the data show very clearly that there’s been an upward trend in rainfalls of 1”+, 2”+, and 3”+ nationwide with respect to the average from 1950 to 2014.

Climate Central applied the same 1”+, 2”+, and 3”+ criteria to the city-specific data. But using one single station can be tricky with precipitation since precipitation totals often vary dramatically over a distance of just a few miles — much more so than temperature. The bar charts here shows the number of calendar days grouped into five-year totals, which should help average out the year-to-year weather fluctuations.