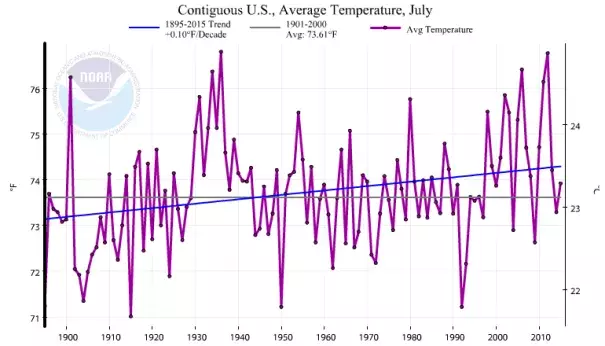
Graph: Contiguous US Average Temperature, July by NOAA / NCEI The graph shows the increase in average temperature for the month of July in the contiguous United States from 1895 through 2015. During the 120-year time span, the US experienced an average temperature increase of 0.1°F per decade. Go to Site