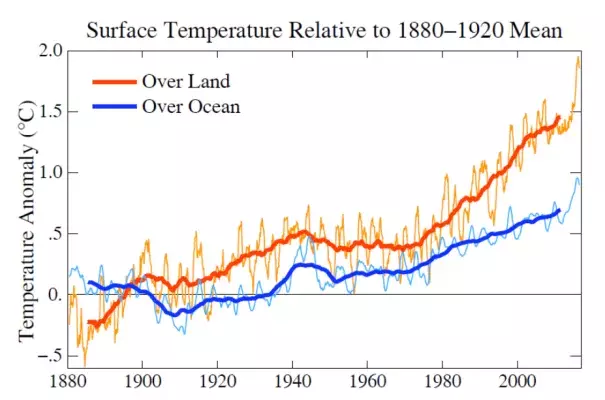
Graph: Global land and global SST anomalies (1880-1920 mean) by Hansen, Sato, Ruedy et al Global land and global ocean surface temperature anomalies. Light lines are 12-month running means and heavy lines are 132-month (11-year) running means. Go to Site