Graph: Global-mean surface temperature evolution
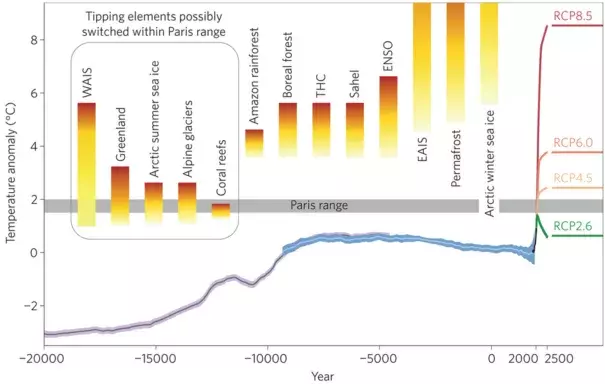
Shown is the global-mean surface temperature evolution from the Last Glacial Maximum through the Holocene, based on palaeoclimatic proxy data (grey and light blue lines, with the purple and blue shading showing one standard deviation), instrumental measurements since 1750 AD (HadCRUT data, black line) and different global warming scenarios for the future.
Threshold ranges for crossing various tipping points where major subsystems of the climate system are destabilized have been added. (Note that the authors follow a tipping point definition which does not require irreversibility, so that sea ice cover is included here.) The range for the West Antarctic Ice Sheet (WAIS) has been adapted to account for the observation that part of it has probably tipped already. THC, thermohaline circulation; ENSO, El Niño–Southern Oscillation; EAIS, East Antarctic Ice Sheet.
