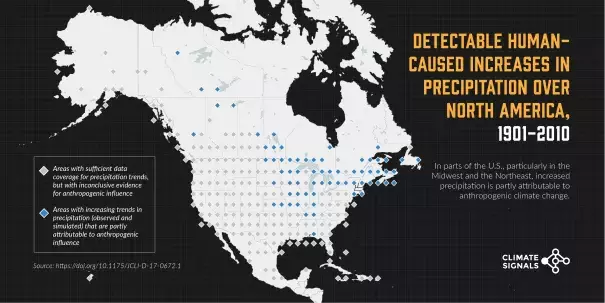
[GRAPHIC] Detectable Human-Caused Increases in Precipitation over North America (1901-2010)
by Adapted from Thomas Knutson and Fanrong Zeng, 2018
For more information on changes in total precipitation due to climate change, click here. To see the original study, click here.
