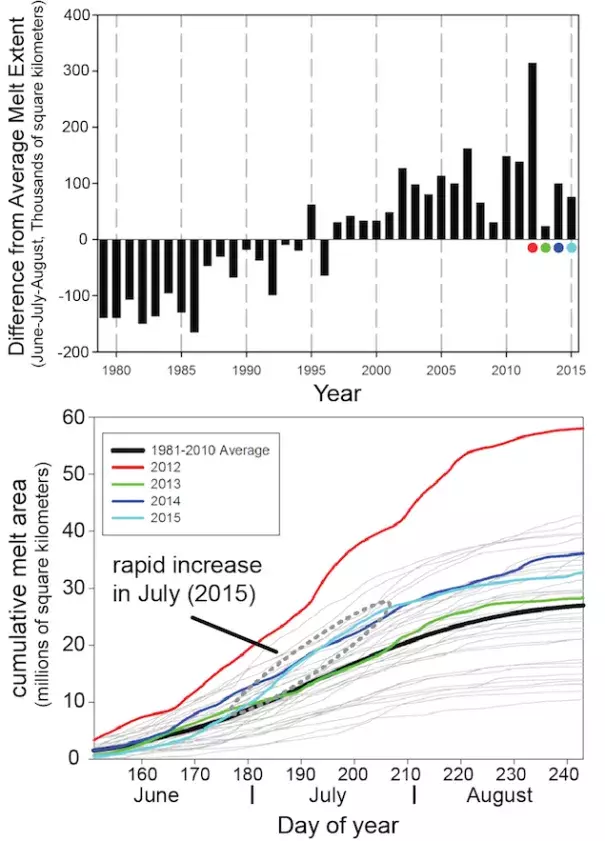
Graphs: Annual melt anomalies and daily growth of melt area
by National Snow and Ice Data Center
The graph at top shows annual melt extent anomalies (difference from average) for 1978 to 2015. The graph at bottom shows daily growth of melt area for 1978 to 2015, showing the four most recent years as colored lines.