Map and chart: Water vapor trends and anomalies
by IPCC AR5 WGI: Climate Change 2013: The Physical Science Basis, Chapter 2, p. 207
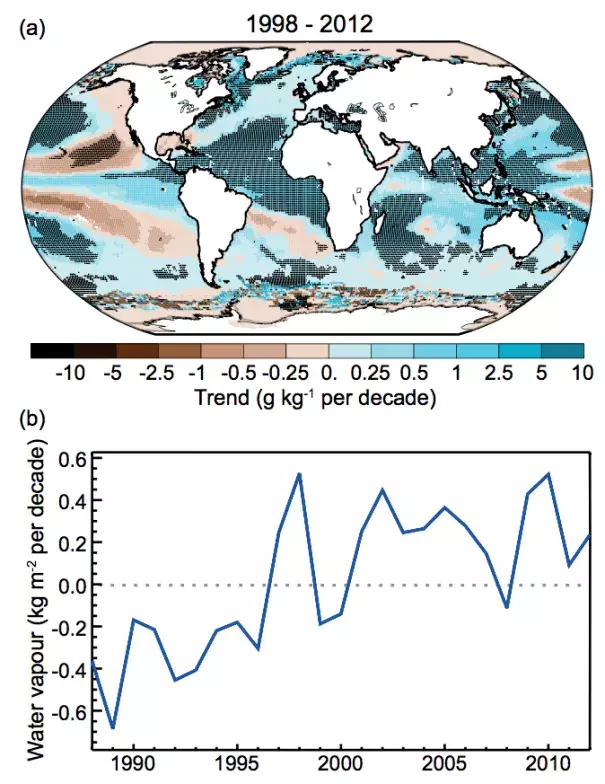
(a) Trends in column integrated water vapor over ocean surfaces for the period 1988–2010. Trends have been calculated only for those grid boxes with greater than 70% complete records and more than 20% data availability in first and last decile of the period. Black plus signs (+) indicate grid boxes where trends are significant (i.e., a trend of zero lies outside the 90% confidence interval).
(b) Global annual average anomalies in column integrated water vapor averaged over ocean surfaces. Anomalies are relative to the 1988–2007 average.
