Map and chart: ZIKV transmission risk anomalies
by Caminade et al, 2016
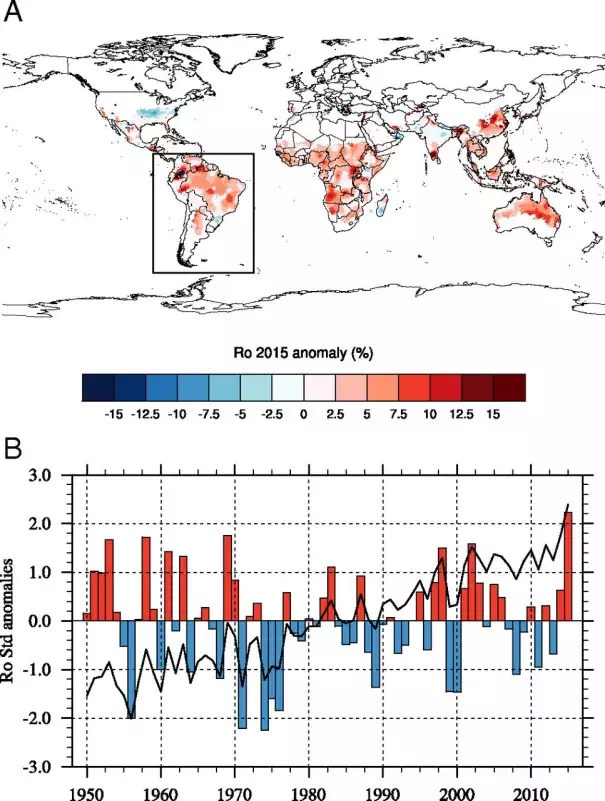
ZIKV transmission risk anomalies.
(A) Annual R0 2015 anomaly (percentage) with respect to the 1950–2015 period.
(B) Standardized R0 anomalies with respect to the 1950–2015 period. The indices have been calculated for the South American continent; A shows the spatial domain definition. The solid line and the colored bars depict raw and linearly detrended anomalies, respectively.
